Drag to pan. Focus the map to use + / − and arrow keys. Set opacity to 0% for imagery only.
Loading the imagery basemap…
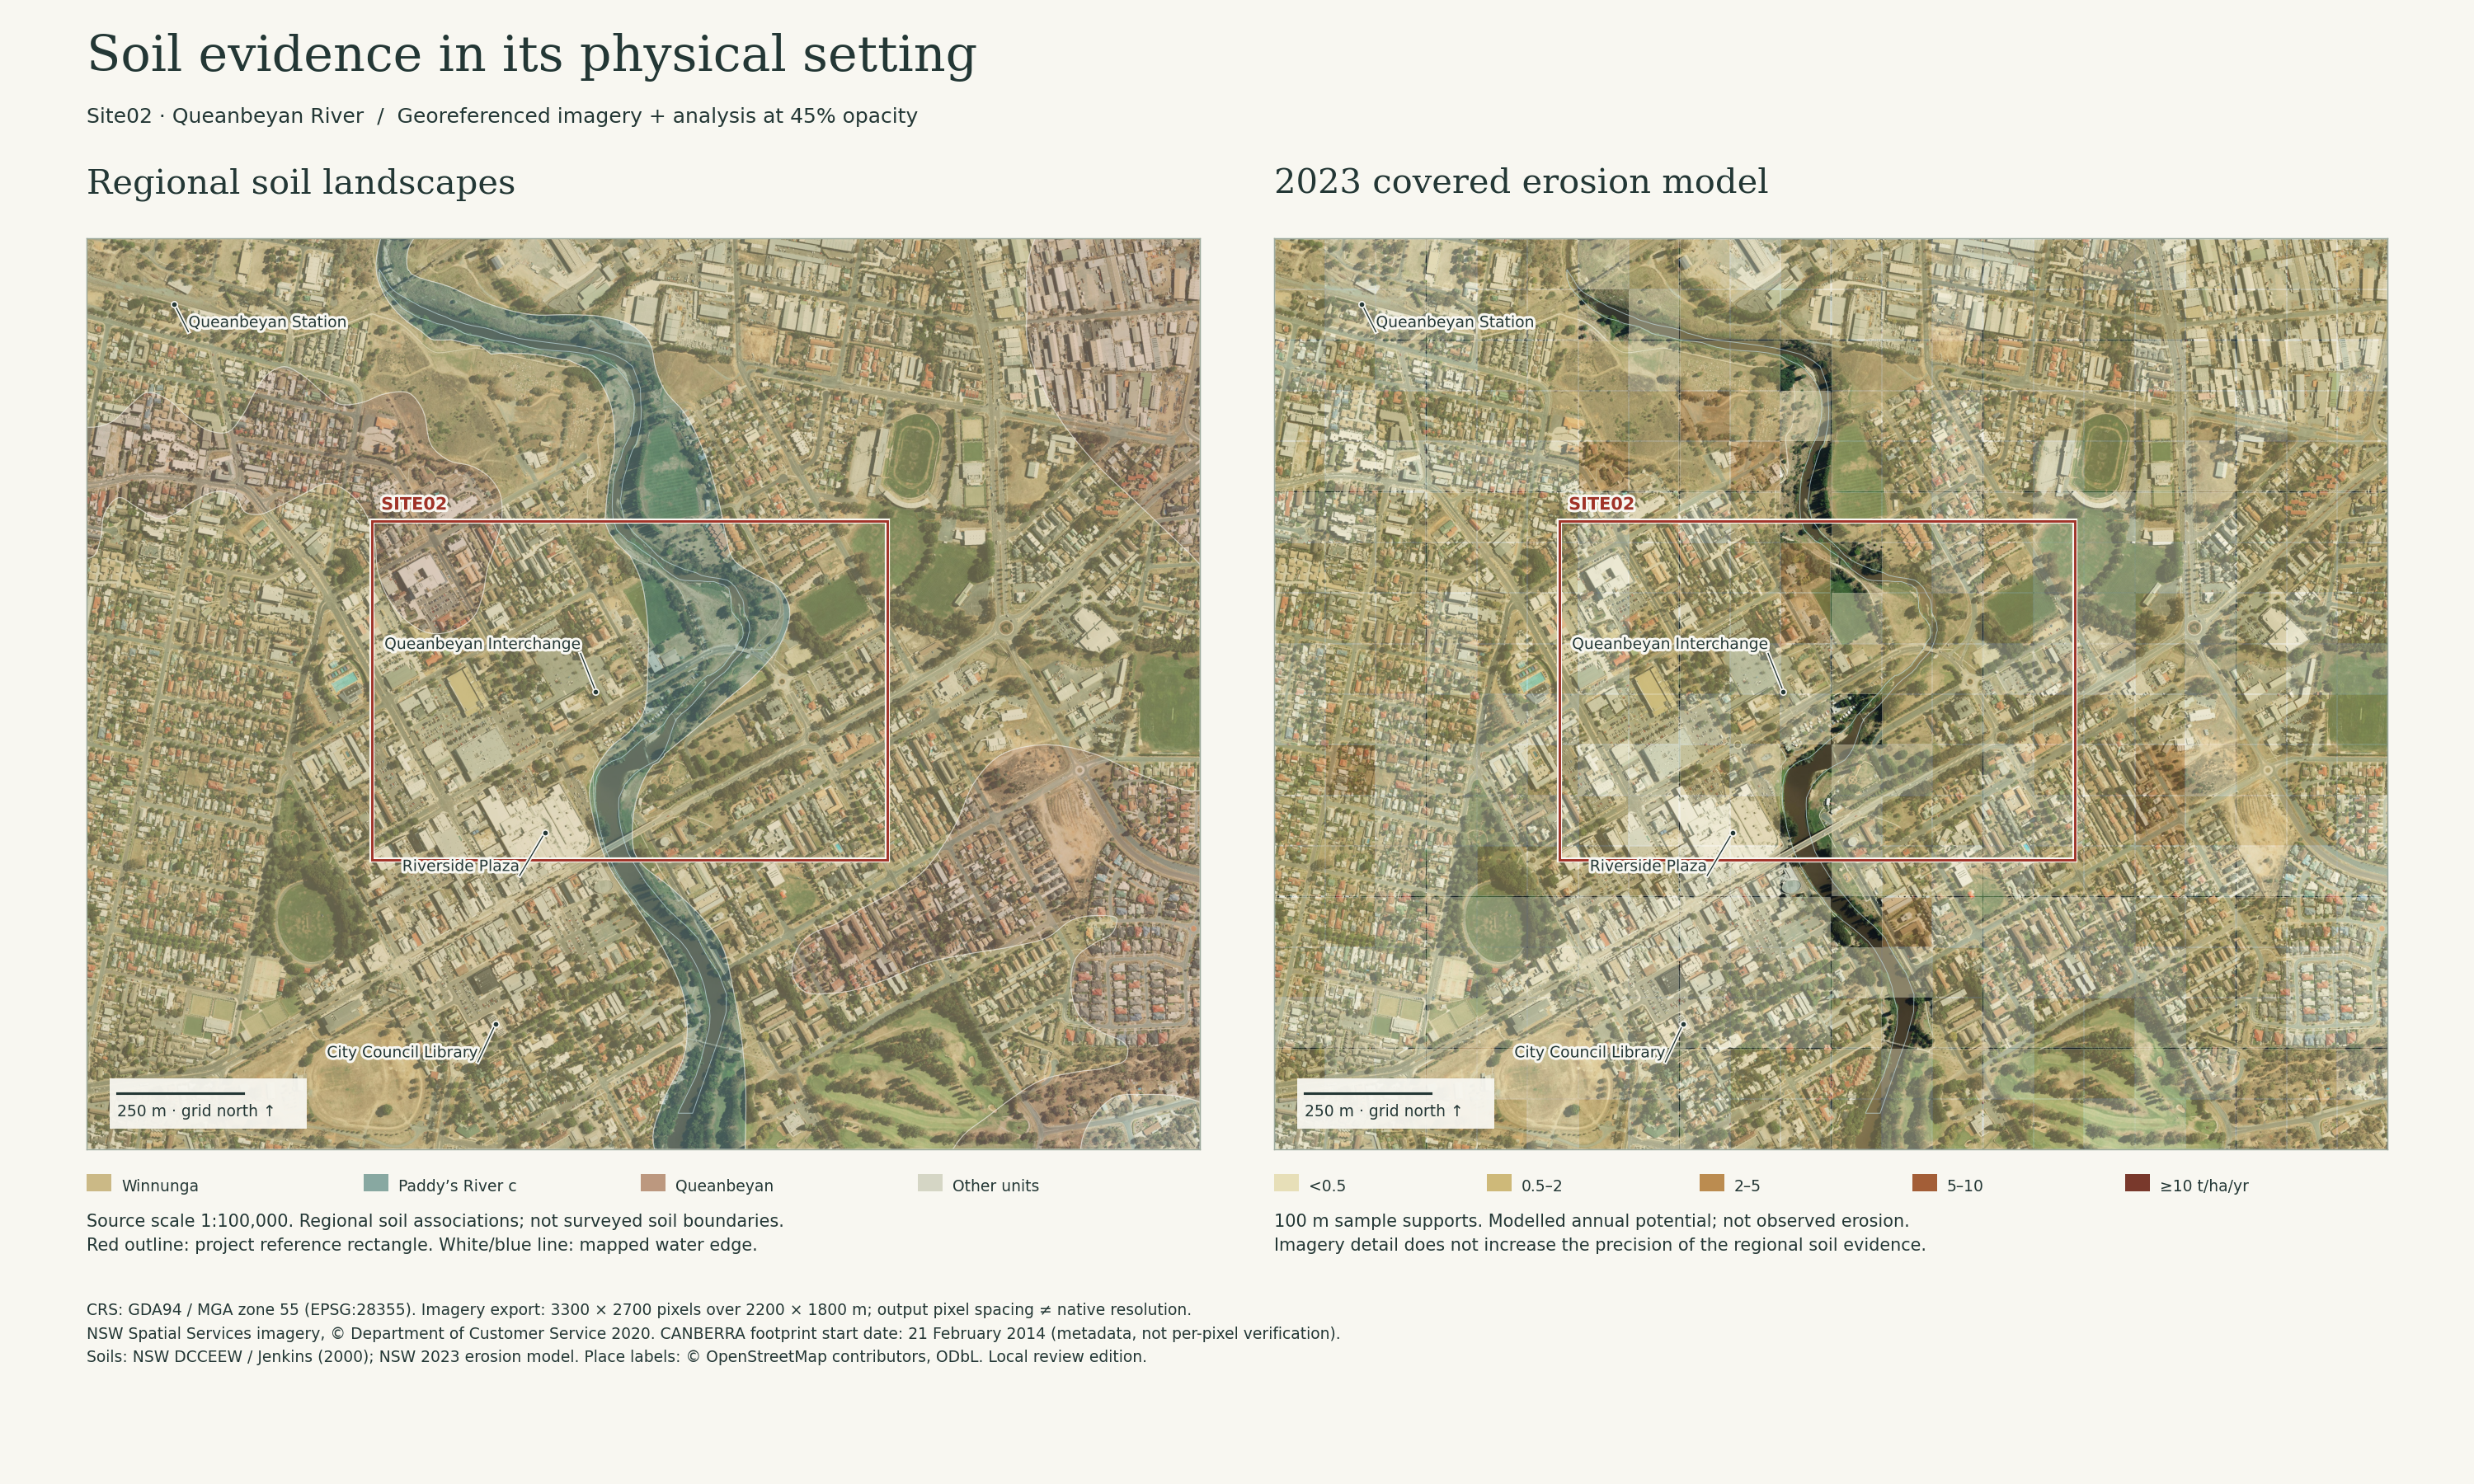
Grid north ↑ · GDA94 / MGA zone 55 (EPSG:28355). Soil colours blend with the image; use 100% opacity and a plain background for unblended categories.
Soil layers © State of NSW / DCCEEW; ACT 2015 DEM and supplied project geometry. Imagery: NSW Spatial Services, © Department of Customer Service 2020; external imagery credits retained in the source metadata. Place labels: © OpenStreetMap contributors, ODbL. Evidence and limitations.
Three landscapes
within the redline.
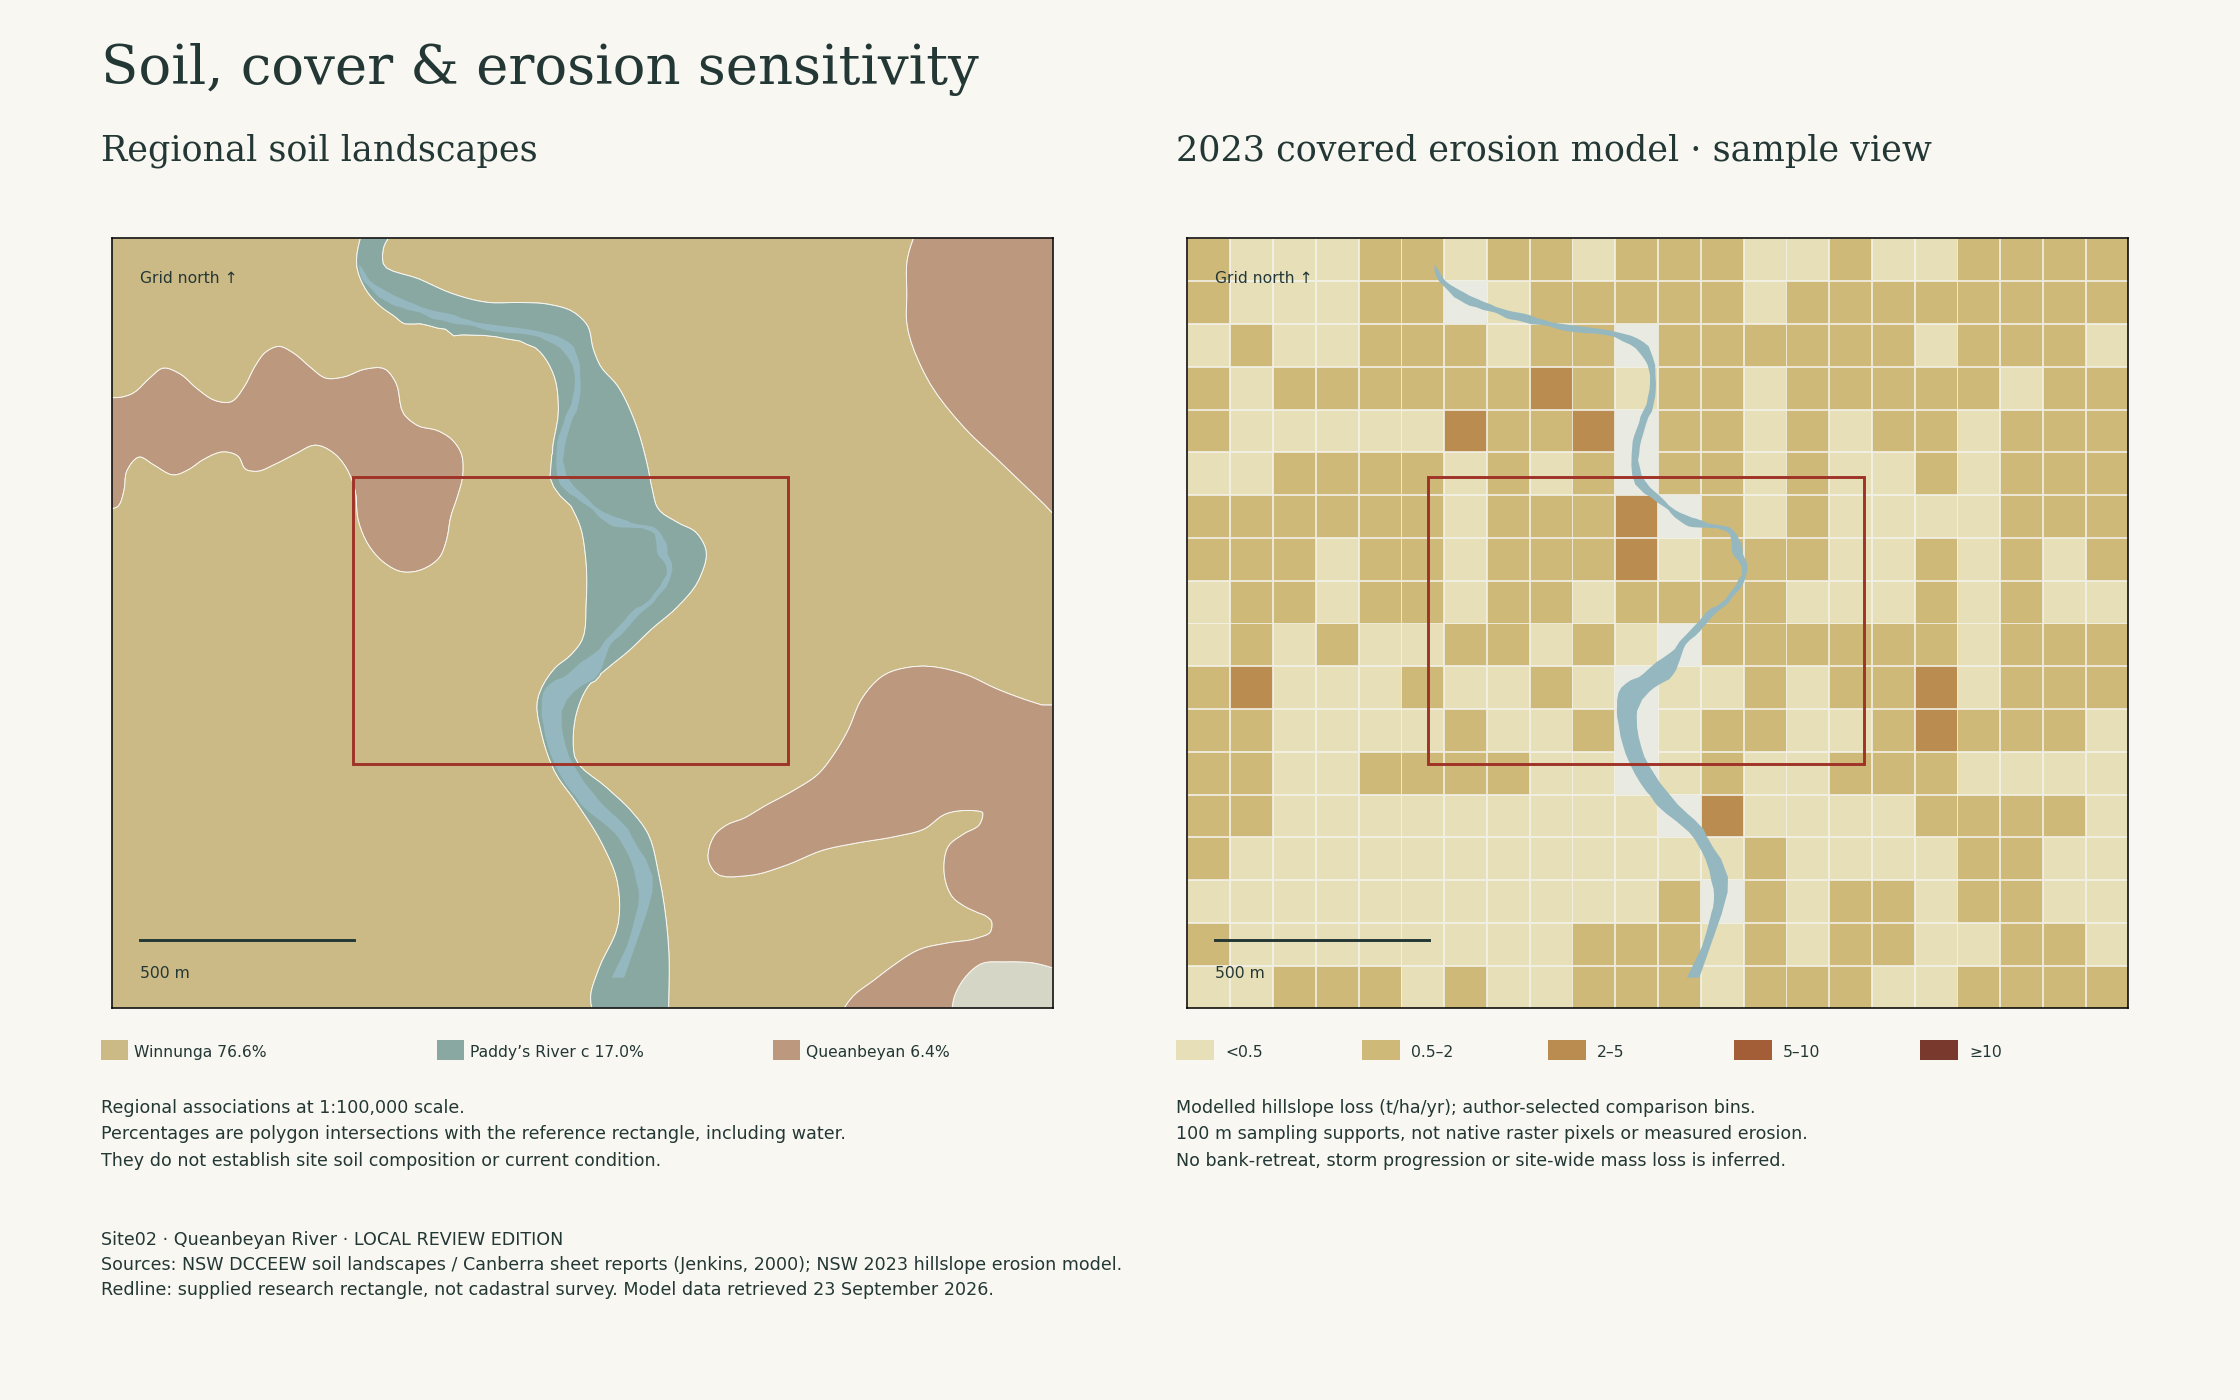
The regional map divides the 68.206 ha reference site into the units below. These are landscape-scale associations; individual beds, urban fill and pavement may differ substantially. The map does not replace a soil investigation.
Canberra 1:100,000 soil-landscape mapping, compiled in the NSW soil landscape service. Areas are GIS intersections with the supplied project rectangle; they include the river. The report descriptions concern the broader soil landscapes, not observations made on this site.
Two processes,
different evidence.
What the simulation can express
The NSW regional model estimates hillslope sheet and rill erosion using RUSLE. Here, its 2023 covered and bare-soil results are used to explore changes in assumed erosivity and cover protection. No extra slope factor is multiplied into that model: its source LS factor already represents terrain effects.
What the river-edge overlay means
Inspection candidates are sample centres within 50 m of mapped water, outside mapped water, and near a 5 m terrain cell with slope ≥10° in a 105 ×105 m window. Those distances and the slope threshold are author-selected screening assumptions.
These candidates are places to inspect, not eroding banks. Riverbank stability, undercutting, roots, cohesive strength, bed shear and channel migration are not modelled. Buildings, paved surfaces and local drainage are not resolved by the regional erosion model.
Evidence and model construction.
A reproducible sensitivity calculation
Ascenario = E × Abare,2023 × qscenario
q2023 = Acover,2023 / Abare,2023
qscenario = min(1, q2023 × cover multiplier), or 1 for bare soil.
E is the selected relative annual erosivity multiplier.
The covered-to-bare ratio expresses the source model's combined cover effect; it is not measured vegetation cover percentage. Scenario values retain the source model's annual soil-loss units (t/ha/yr), but are hypothetical annualised potentials, not predicted future losses. No soil mass total is calculated for the site.
Severity bins are author-selected for comparison: <0.5, 0.5–2, 2–5, 5–10 and ≥10 t/ha/yr. They are not regulatory or engineering thresholds. The same bins apply across all scenarios.
Terrain as supporting evidence
Slope is calculated from complete 5 ×5 m averages of the source 1 m ACT 2015 DEM using centred differences. Missing ground and missing neighbours remain unknown. Slope is supporting terrain evidence and is not itself an erosion rate. The vertical datum remains unverified.
Locating the soil evidence
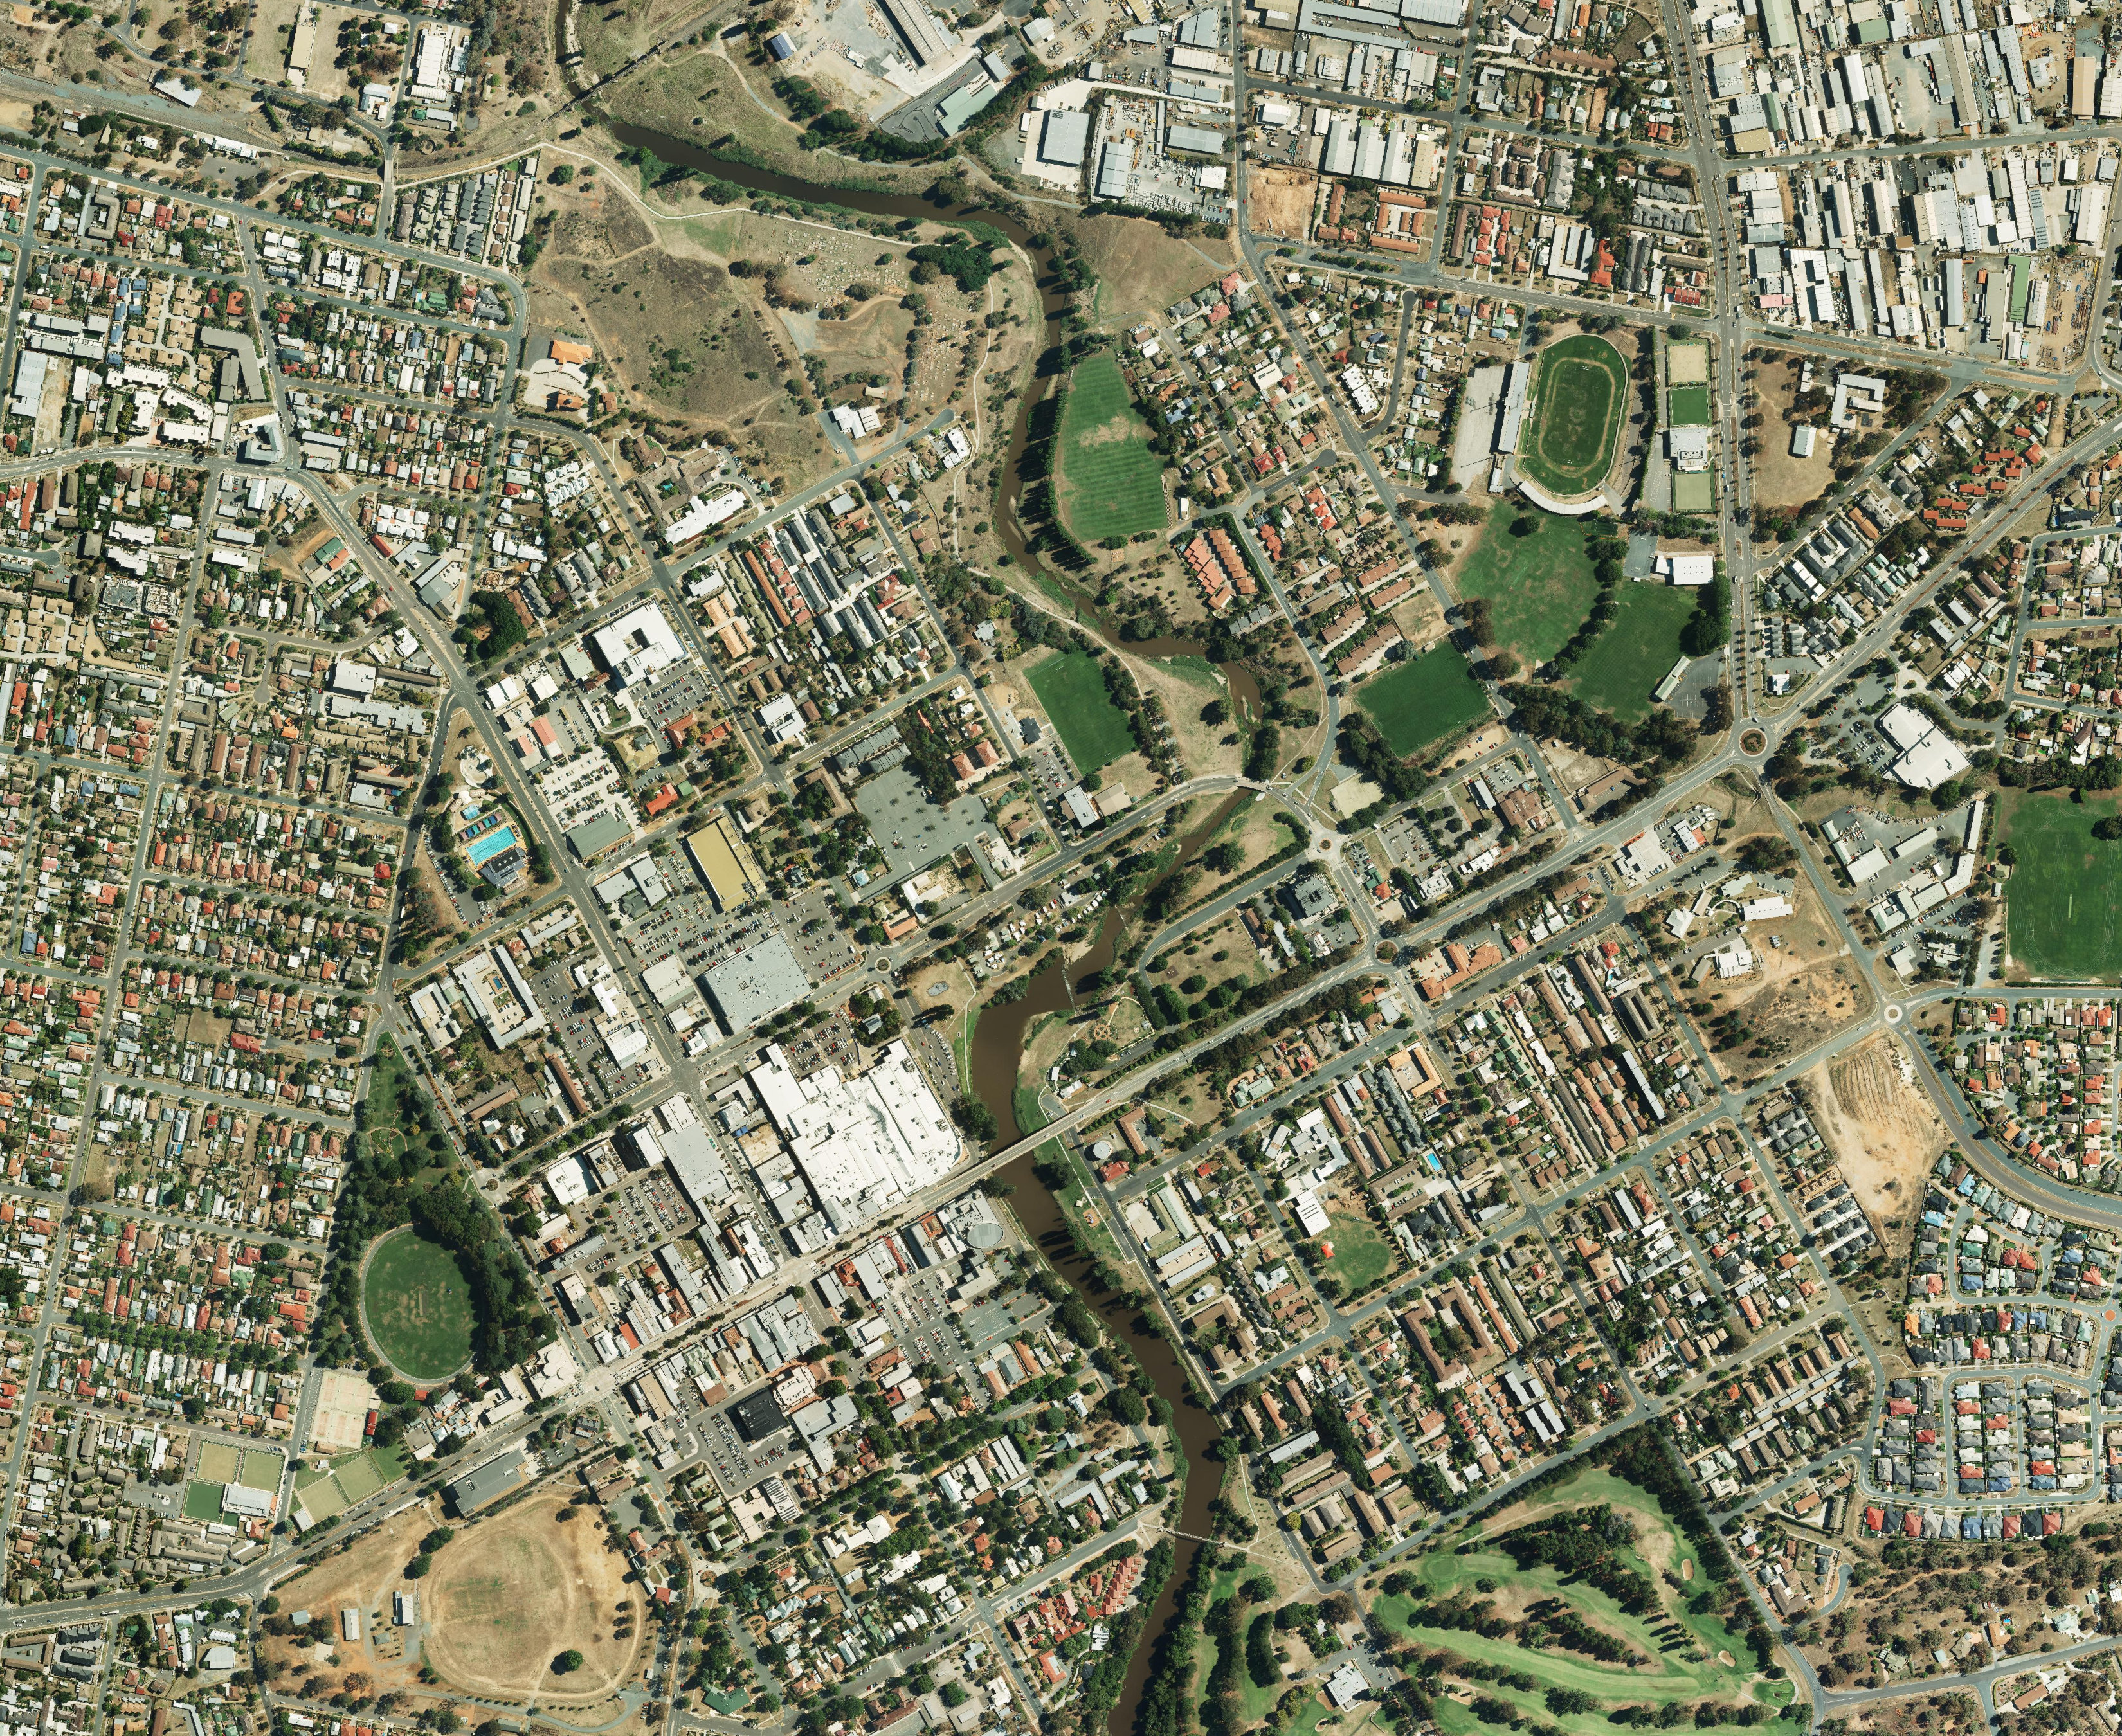
The official NSW imagery export uses the same EPSG:28355 extent as the analysis layers: E 702200–704400 m, N 6085000–6086800 m. The basemap is bundled with this website and does not require a live imagery service.
The intersecting CANBERRA imagery footprint records a block start date of 21 February 2014. This is metadata, not independent verification of each mosaic pixel. The export was retrieved on 23 September 2026; retrieval is not capture. The image is older than the 2023 soil model and may show different buildings, land cover or river conditions.
Imagery supports orientation. It does not improve the 1:100,000 soil mapping or the 100 m model sampling, and does not establish exact soil boundaries, current erosion or survey accuracy.
Sources retained for review
- NSW Soil Landscapes of Central and Eastern NSW; Canberra sheet reports by B. R. Jenkins (2000).
- NSW Modelled Hillslope Erosion: 2023 covered/bare layers and RUSLE K/LS layers. Retrieved 23 September 2026.
- Official raster service: 396 point queries on a regular 100 m grid. Values are service samples, not downloaded native rasters; original responses are retained.
The K factor describes modelled soil erodibility; it is not a site laboratory test. No spatial pH, salinity, infiltration, texture fraction, soil organic carbon, contamination or bearing-capacity measurements have been acquired for Site02. Regional soil descriptions are qualitative evidence only.
Review priorities: verify soil materials and urban fill; test dispersion and texture; map actual bare ground and drainage outlets; inspect bank condition and roots; then calibrate any site-scale erosion or hydraulic model.