A river with
a flood history.
Four historical events, reconstructed in the official 2020 study. Play through their peak-condition maps, then explore the documented rise and recession in December 2010.
May 1925 · official peak reconstruction
Figure C2.3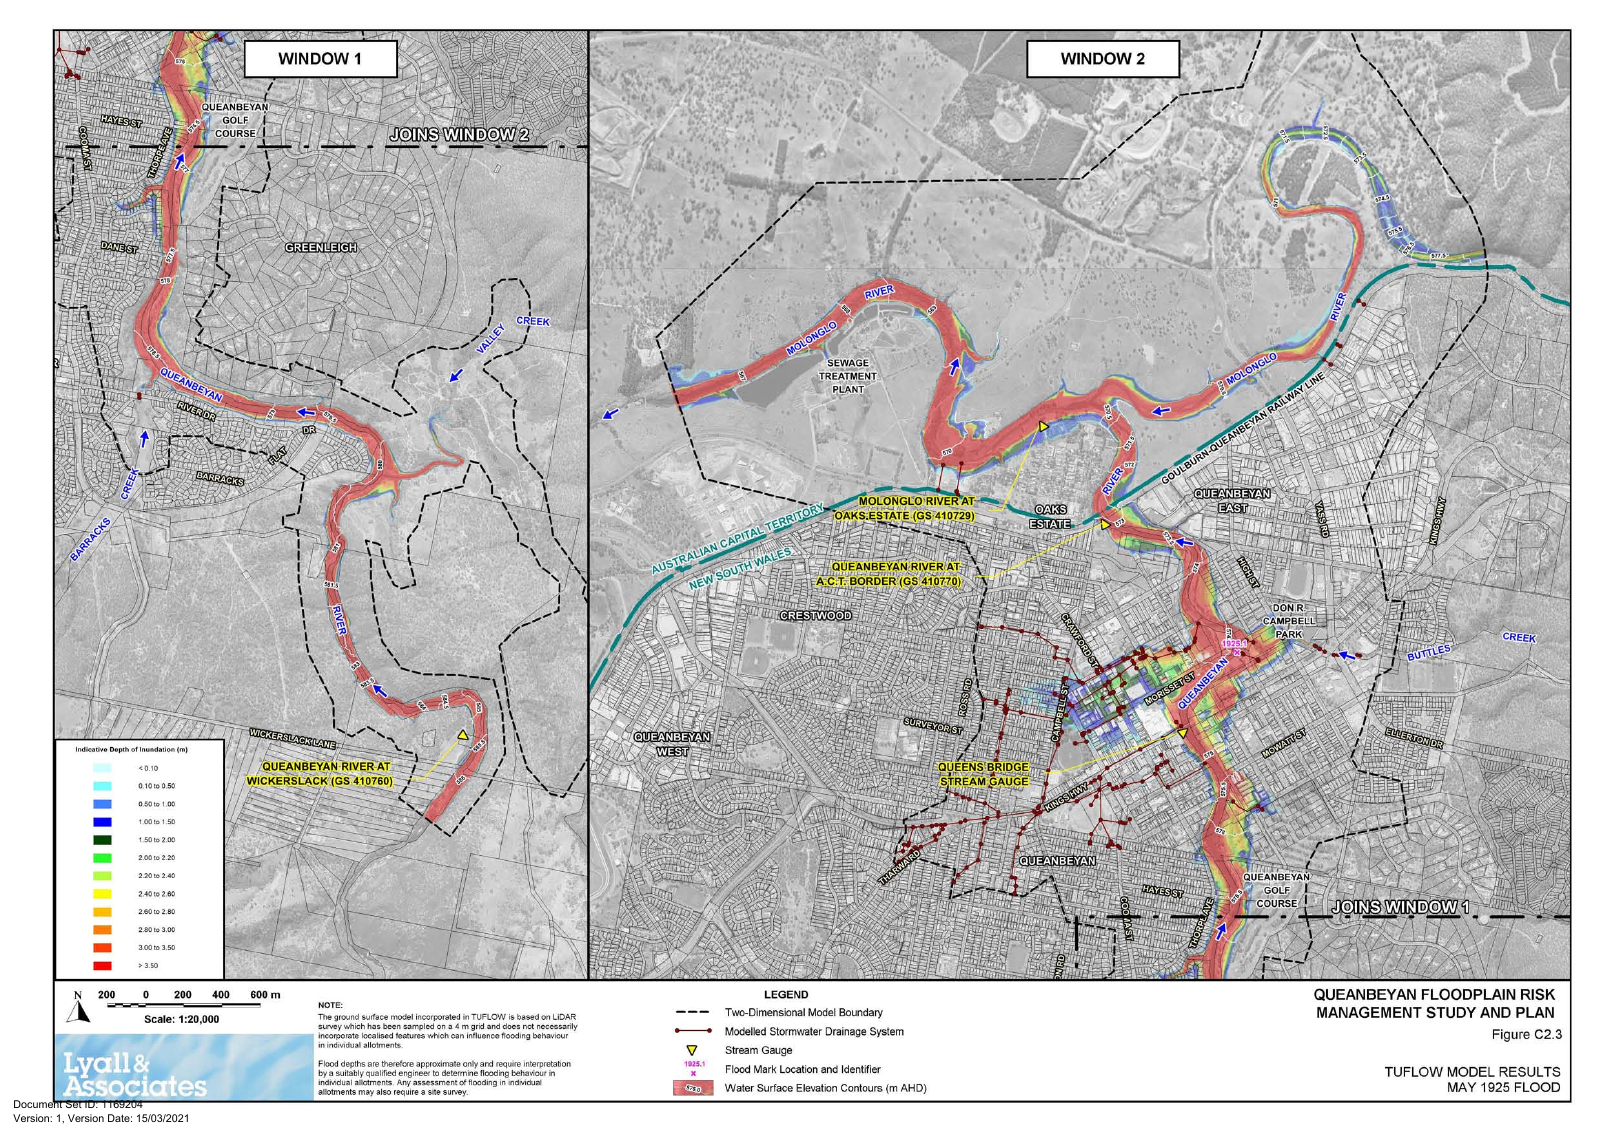
© Queanbeyan-Palerang Regional Council 2020; prepared by Lyall & Associates. Original map geometry, legends and source notices retained. See the complete source figures and reuse notes.
Reading this reach
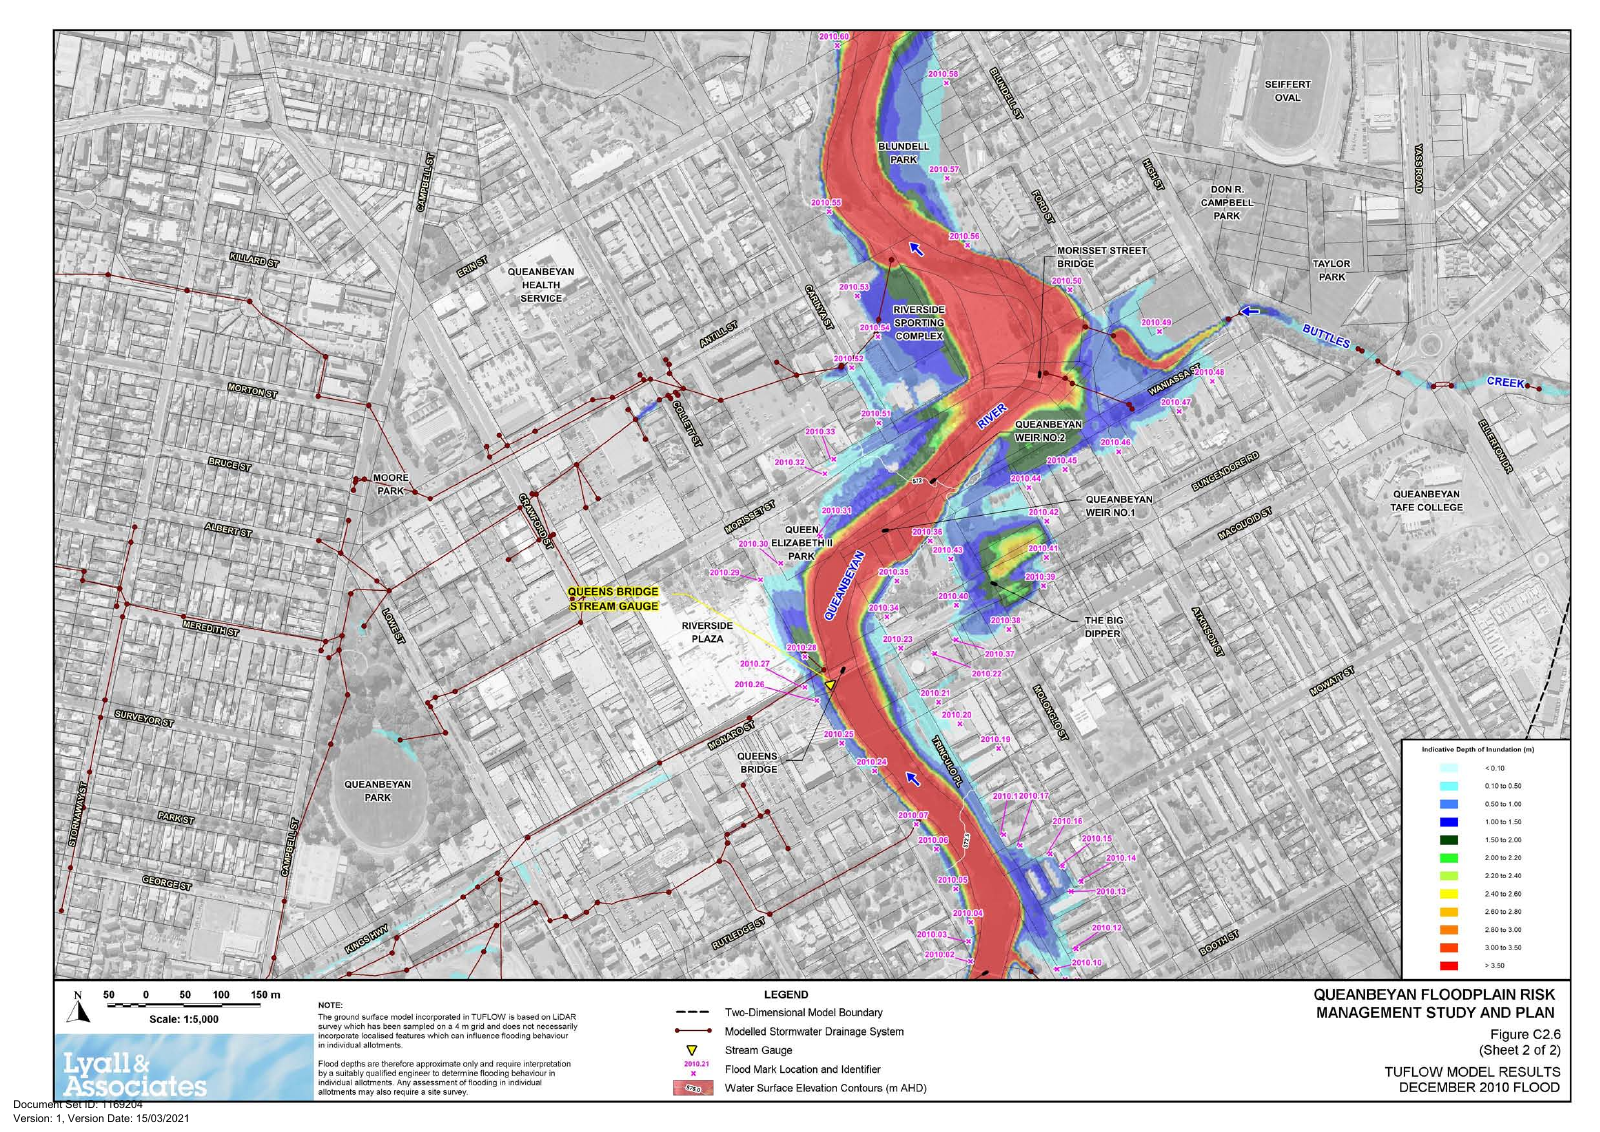
Use Morisset Street, Buttles Creek and Queens Bridge as shared landmarks. The source maps show the corridor around Site02, including riverfront land and urban drainage connections. Inspect the enlarged 2010 sheet for local flood-mark evidence.
What changes across events
Compare modelled peak extent and depth alongside each event’s gauge height and dam context. A difference between maps cannot be attributed to one cause alone. Recent species records do not establish which organisms were affected by historical floods.
A rapid rise, followed by recession.
Discrete values reported in Section 2.4.8, PDF page 27. The horizontal axis represents elapsed time; the animation advances only between documented milestones.
Reported gauge stage. The available text supplies selected milestones, not a continuous measured hydrograph.
The final downward symbol means below 4.2 m, not a measured value of exactly 4.2 m. The map at right shows the peak reconstruction throughout; it is not a changing footprint for these times.