Ecological evidence,
at two spatial scales.
The 2 km site buffer contains 3,435 retained observations and 371 distinct taxon labels, including 327 at species rank. These are records of presence, not an inventory of individuals or a complete habitat survey.
Locate the records. Inspect the evidence.
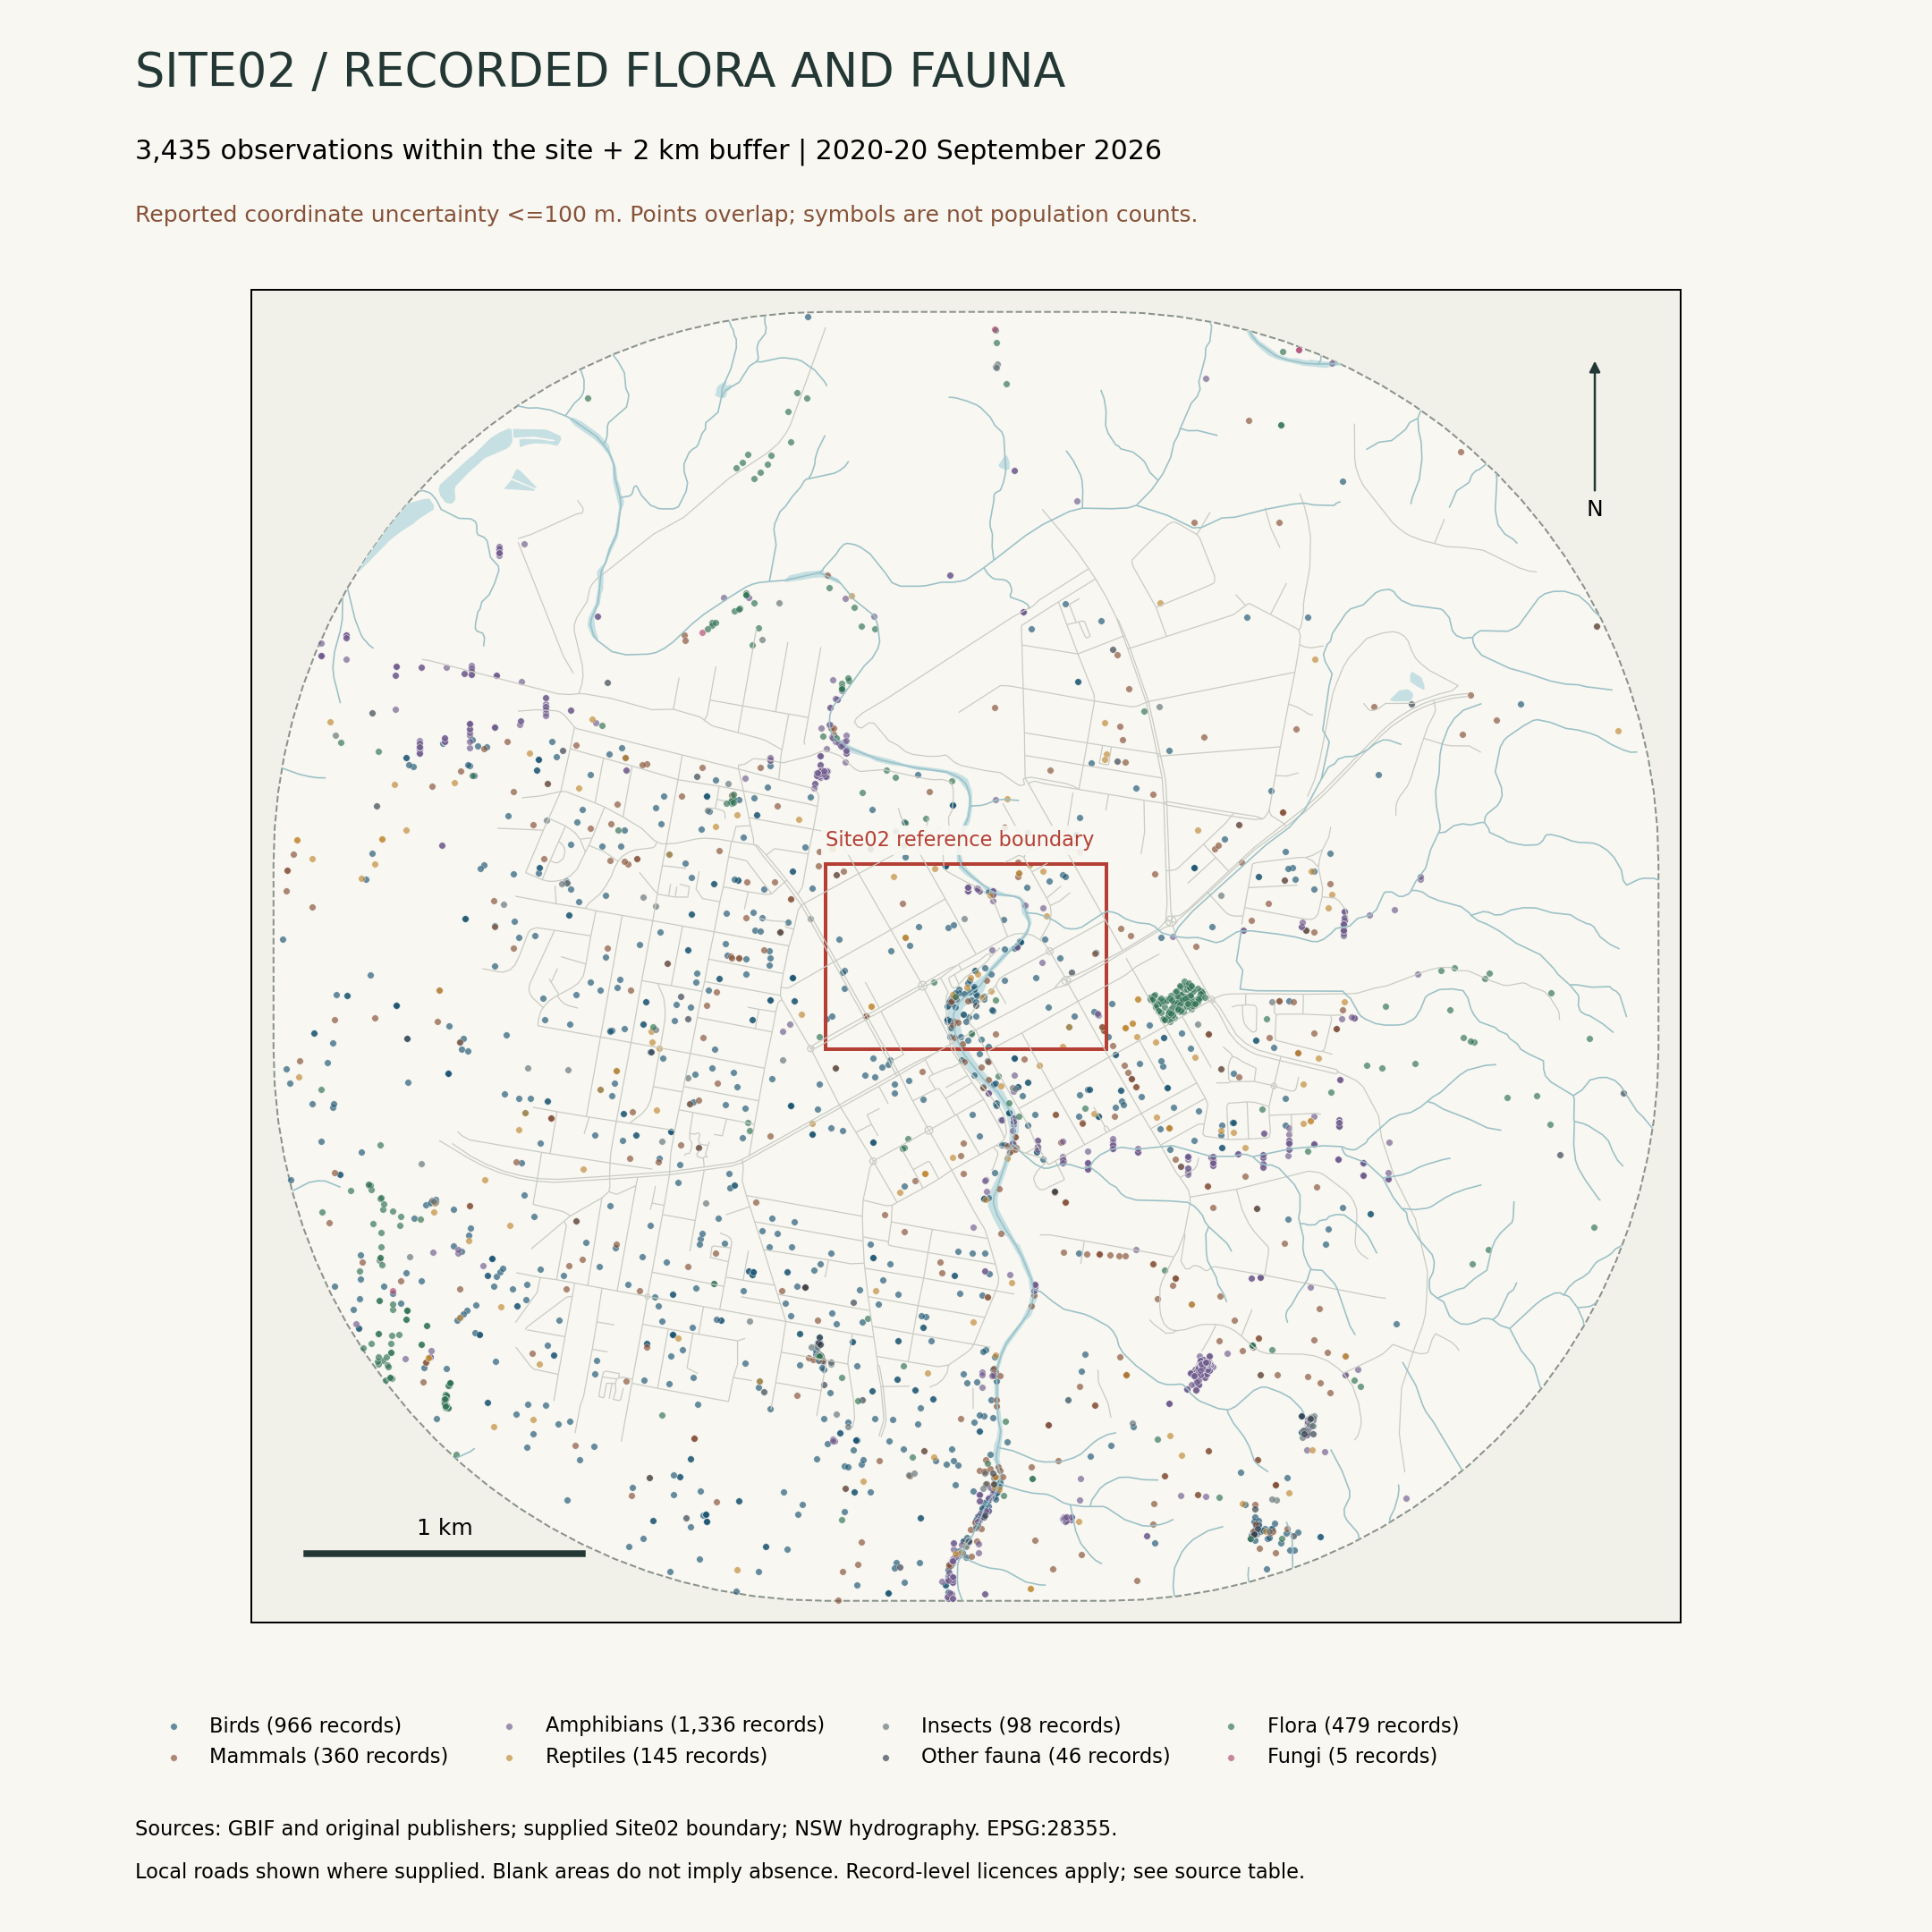
3,435 records · 371 taxon labels · 212 records inside Site02
Community overlay: ochre = PCT 3376; dark green = PCT 4085; grey-green = other native communities. Hover over a polygon for its name. Unclassified land is not necessarily unvegetated.
GDA94 / MGA zone 55 (EPSG:28355); north is up. All points retain their reported locations, including overlaps. Context hydrography and local roads are shown where supplied; blank areas do not indicate absence.
Compare observations in the 500 m context grid
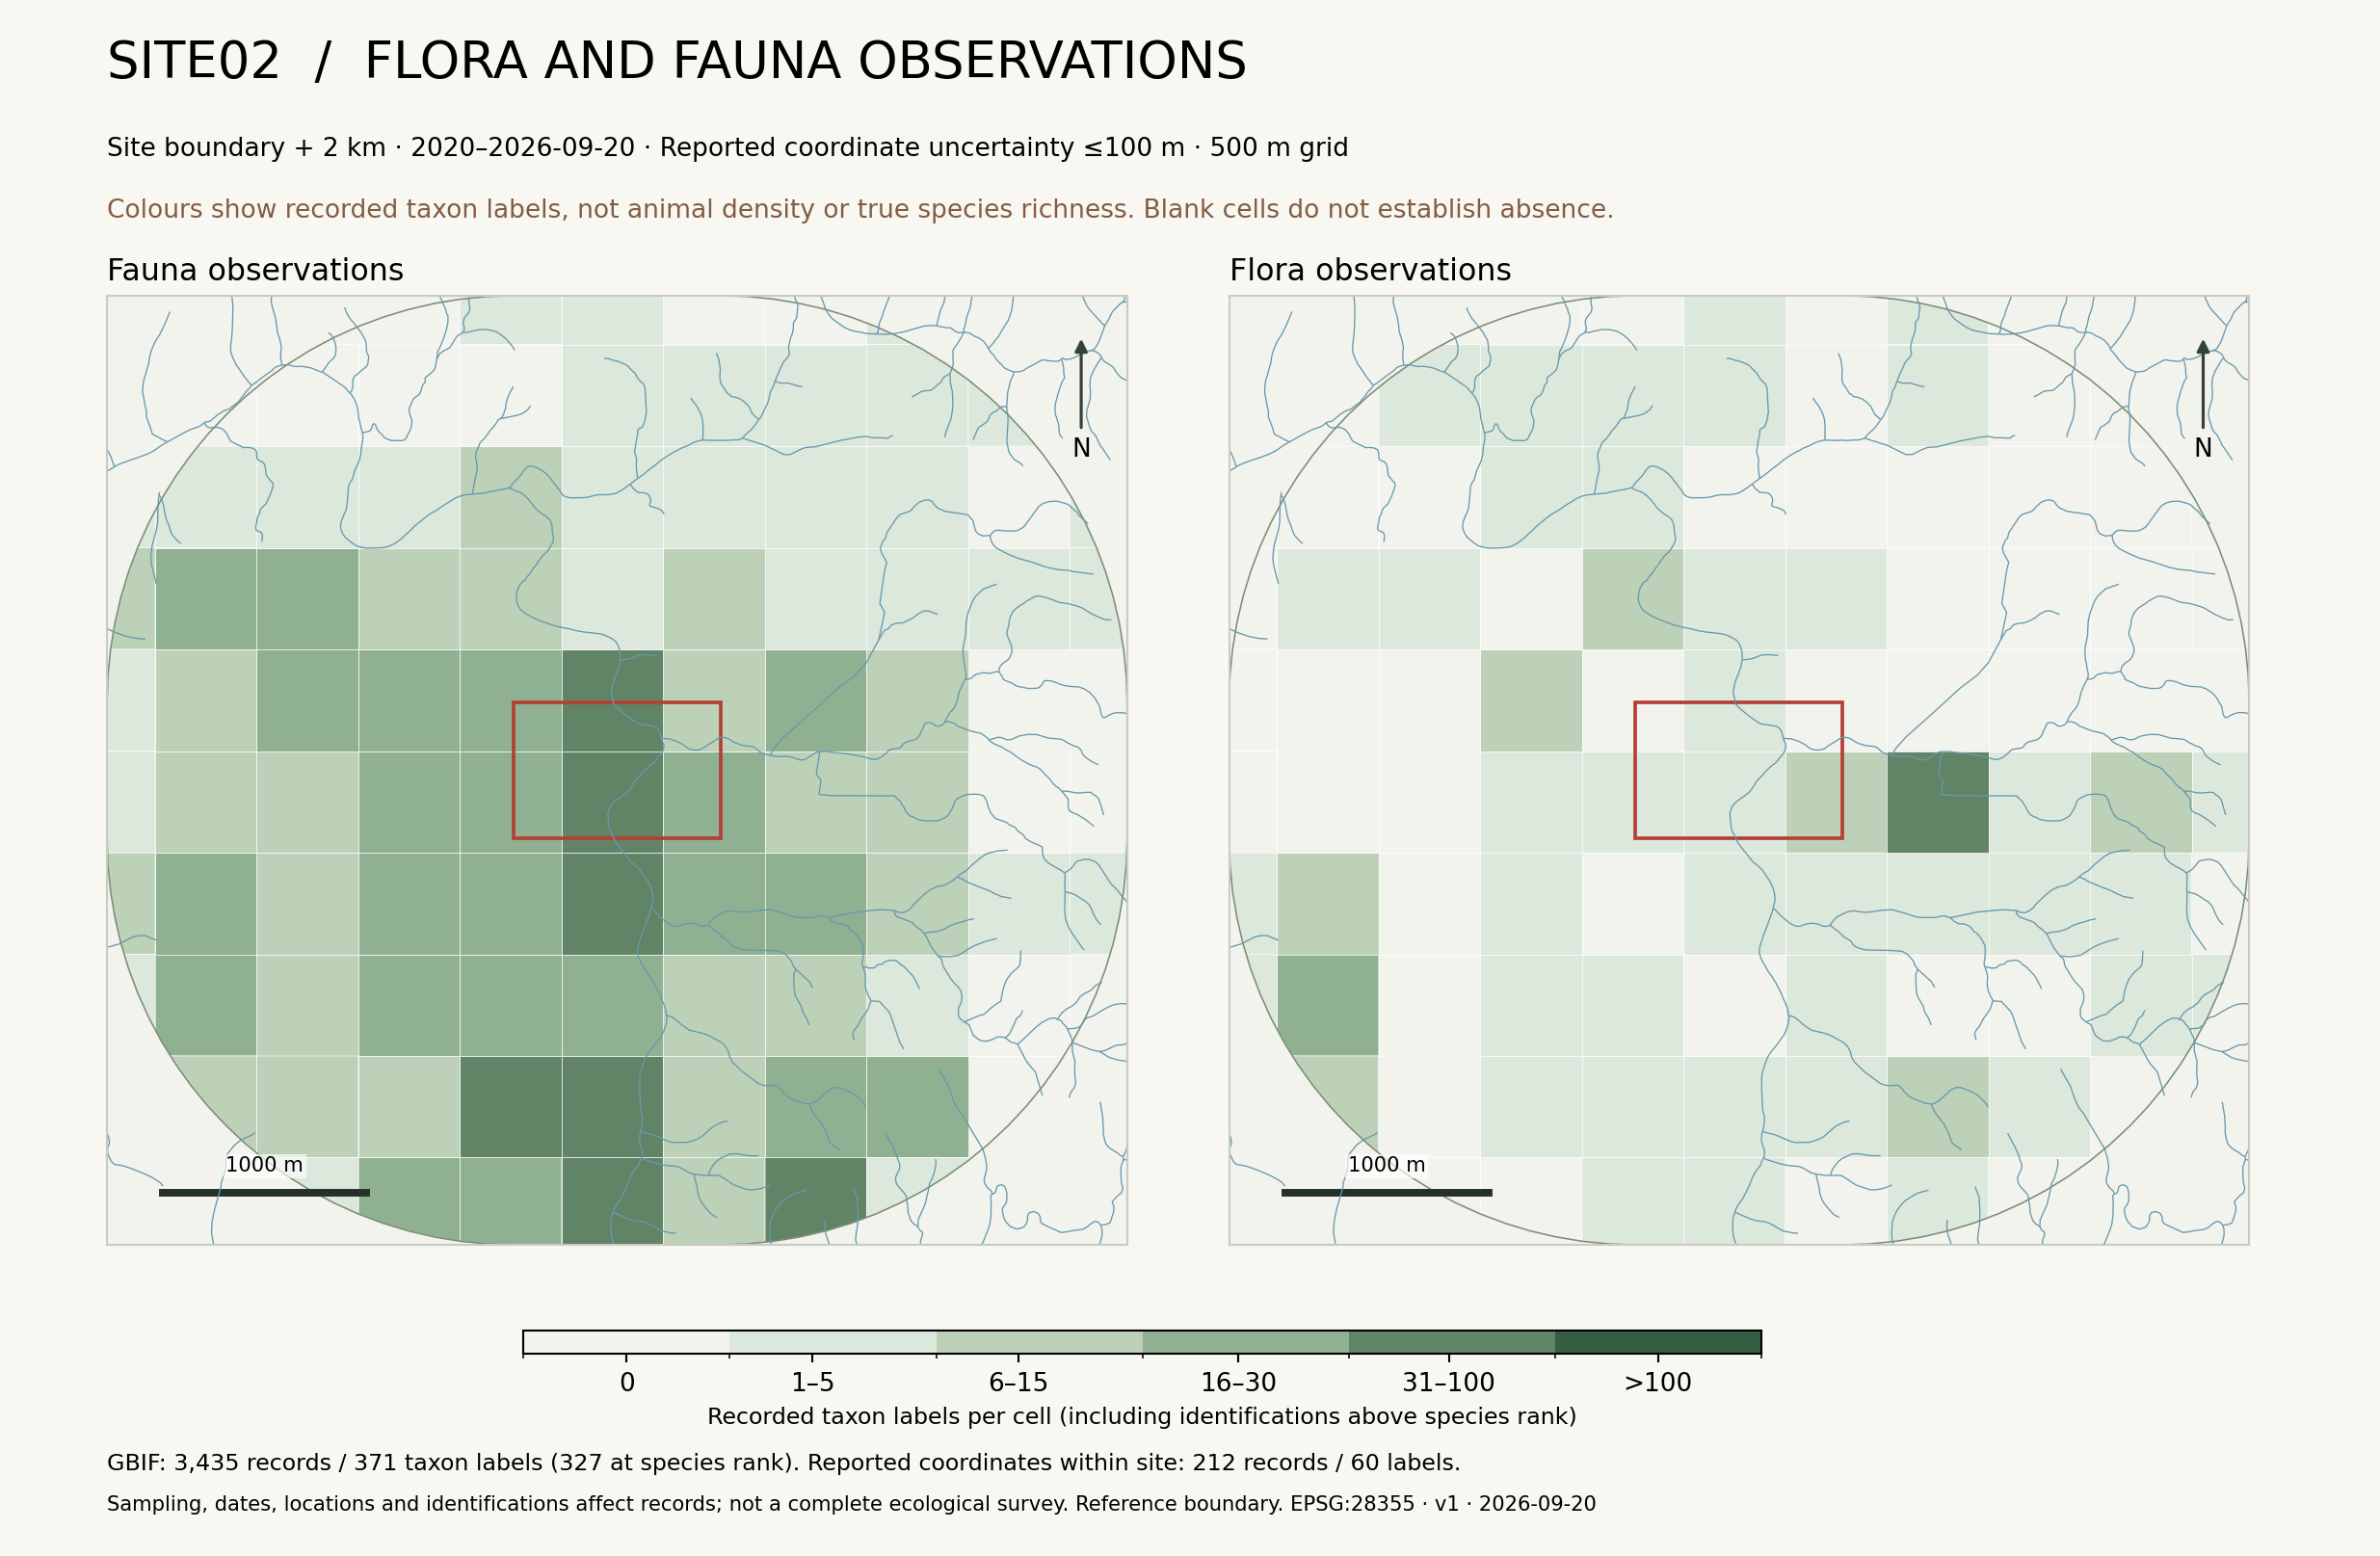
Reading the observation record
Sampling effort, season, location accuracy and identification affect the map. Darker cells should not be interpreted as higher actual population density or biodiversity.
Only five retained plant records have reported coordinates inside the site. A field botanical survey is needed to describe its plant community.
| Taxon | 2 km buffer | Within site |
|---|---|---|
| PlatypusOrnithorhynchus anatinus | 28 records | 3 records |
| RakaliHydromys chrysogaster | 18 records | 7 records |
Site membership uses reported coordinates. Counts are not numbers of individuals, and points do not identify burrows.
A landscape with
a longer history.
Official extant and reconstructed pre-clearing vegetation maps provide context for the river corridor. Community polygons are regional classifications; they are not individual-tree surveys.
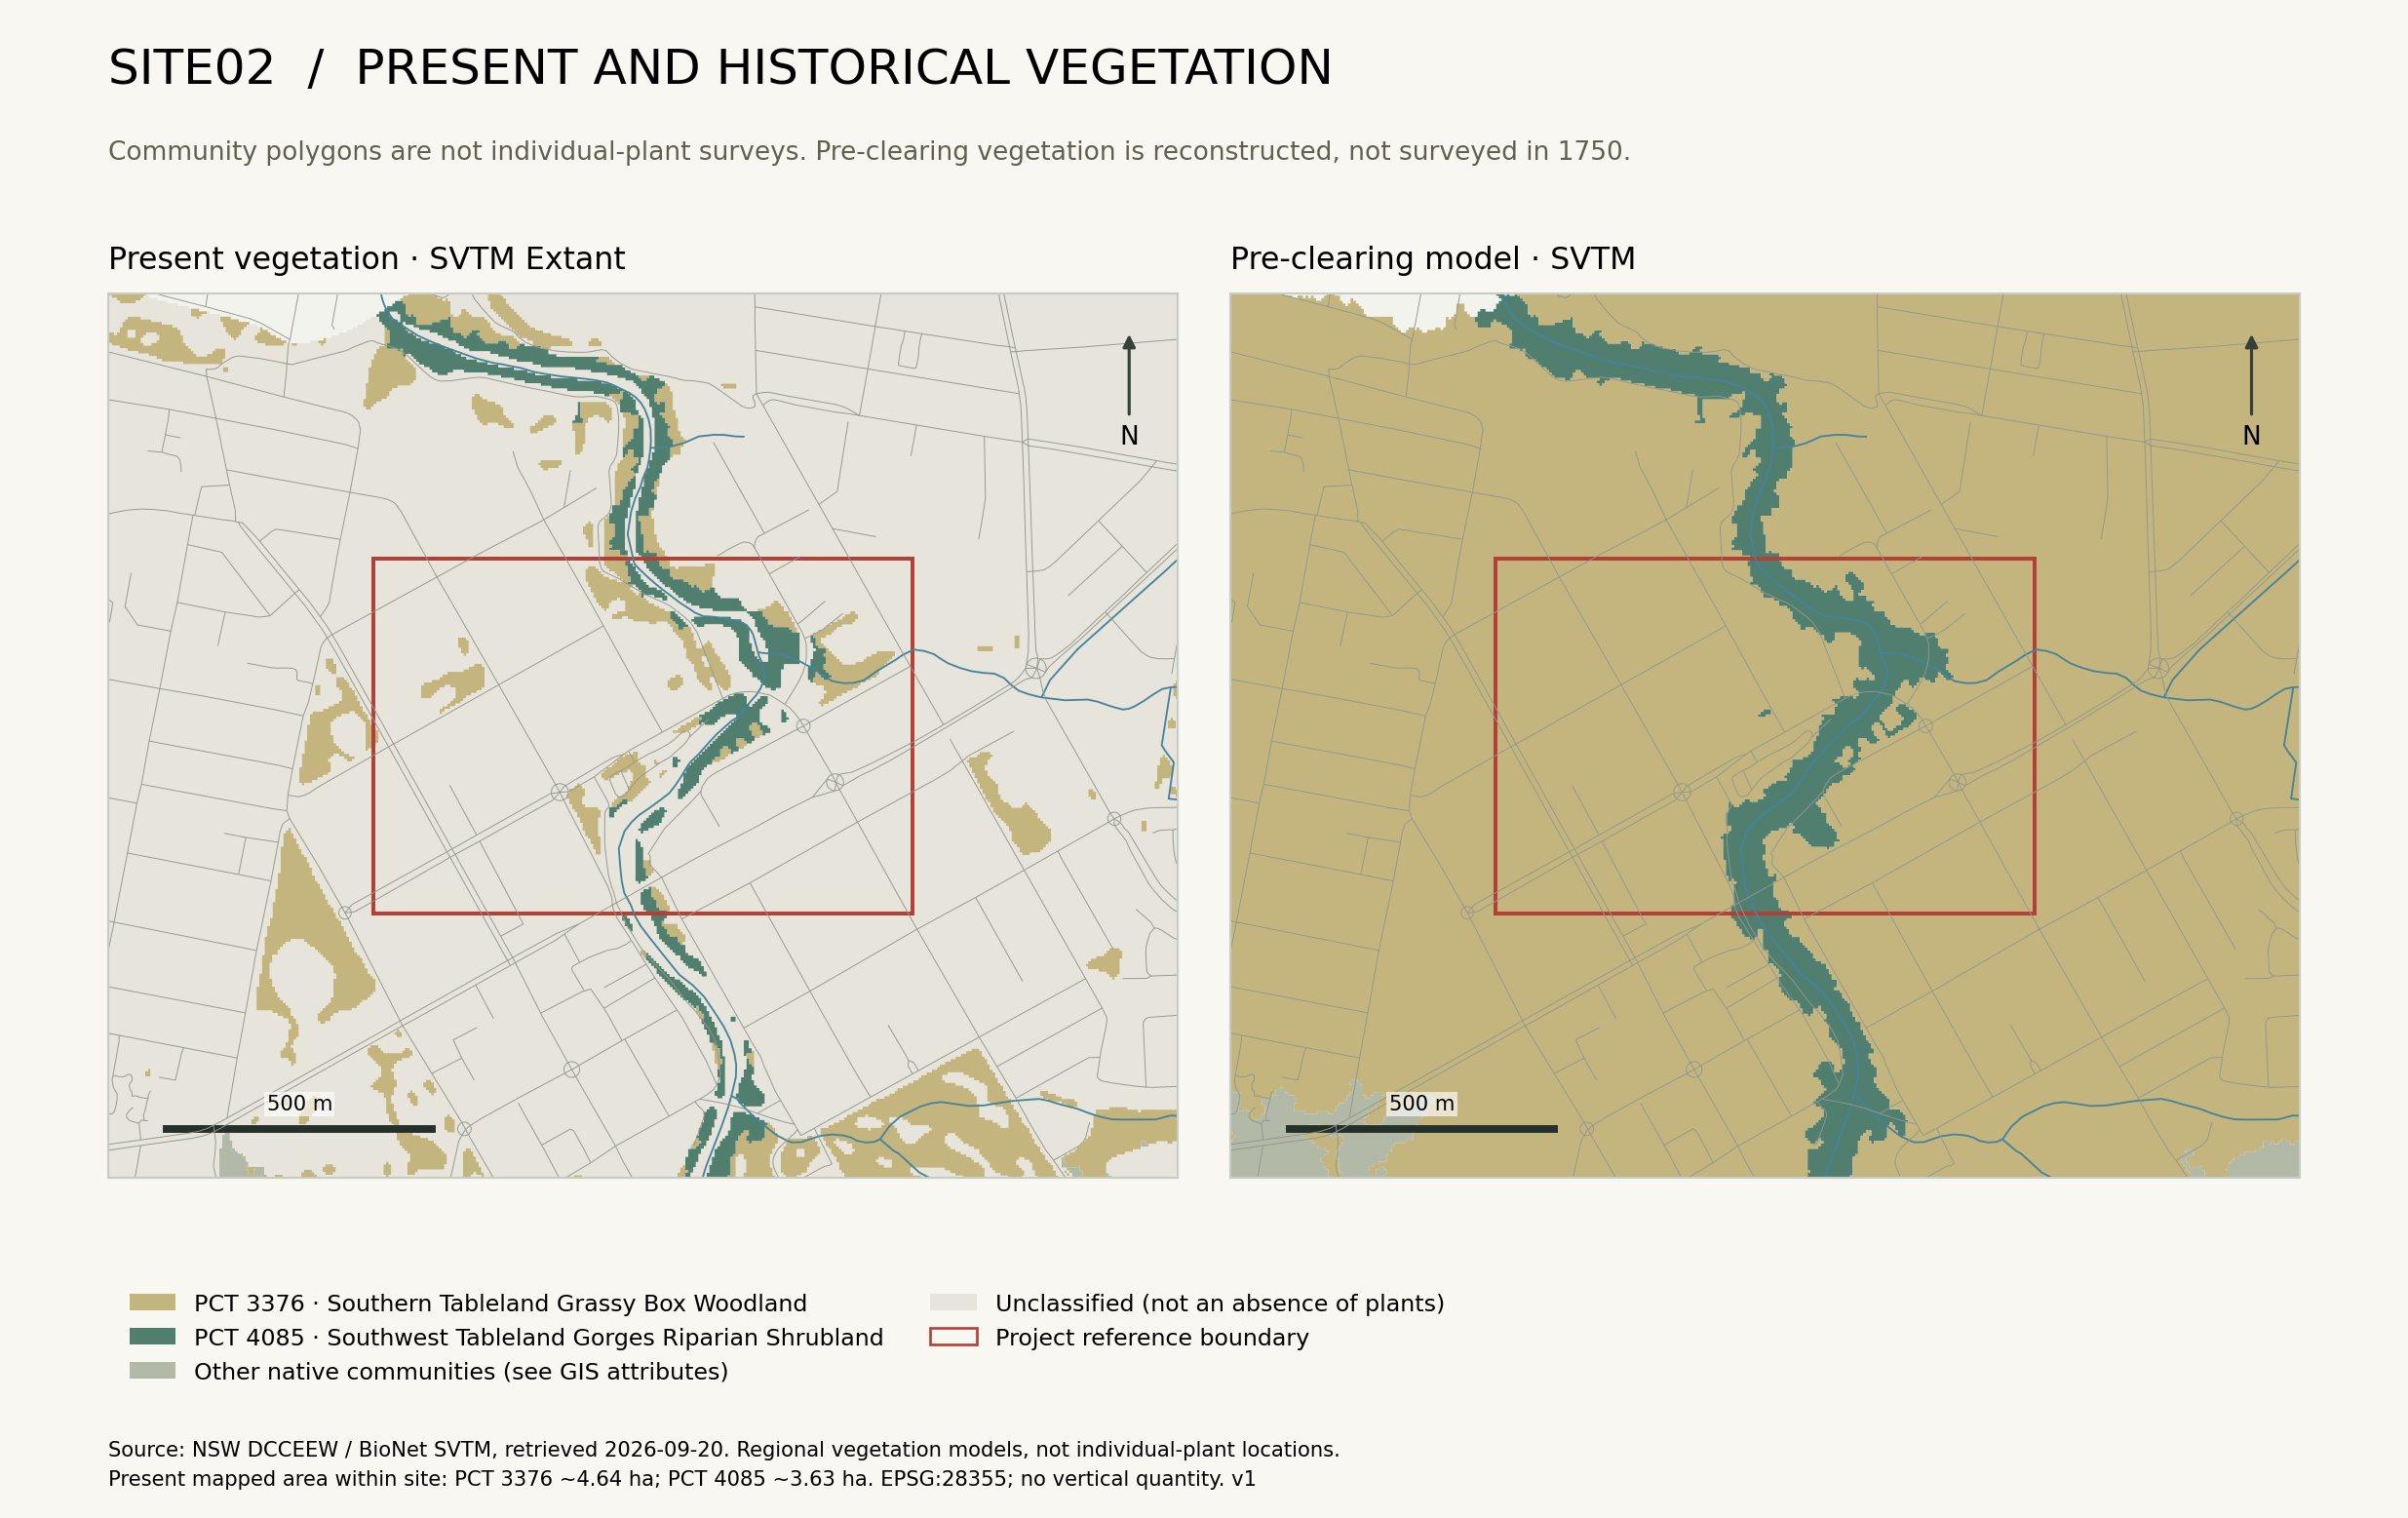
From community to corridor
Compare these mapped communities with historic aerial imagery and field observations. Separate vegetation removal, changes in species composition and differences in what a map classifies.
| Plant Community Type | Extant | Pre-clearing model |
|---|---|---|
| PCT 3376Southern Tableland Grassy Box Woodland | 4.64 ha | 59.83 ha |
| PCT 4085Southwest Tableland Gorges Riparian Shrubland | 3.63 ha | 8.38 ha |
Different model definitions and uncertainties prevent a direct, precise interpretation as vegetation loss.