The river,
over time.
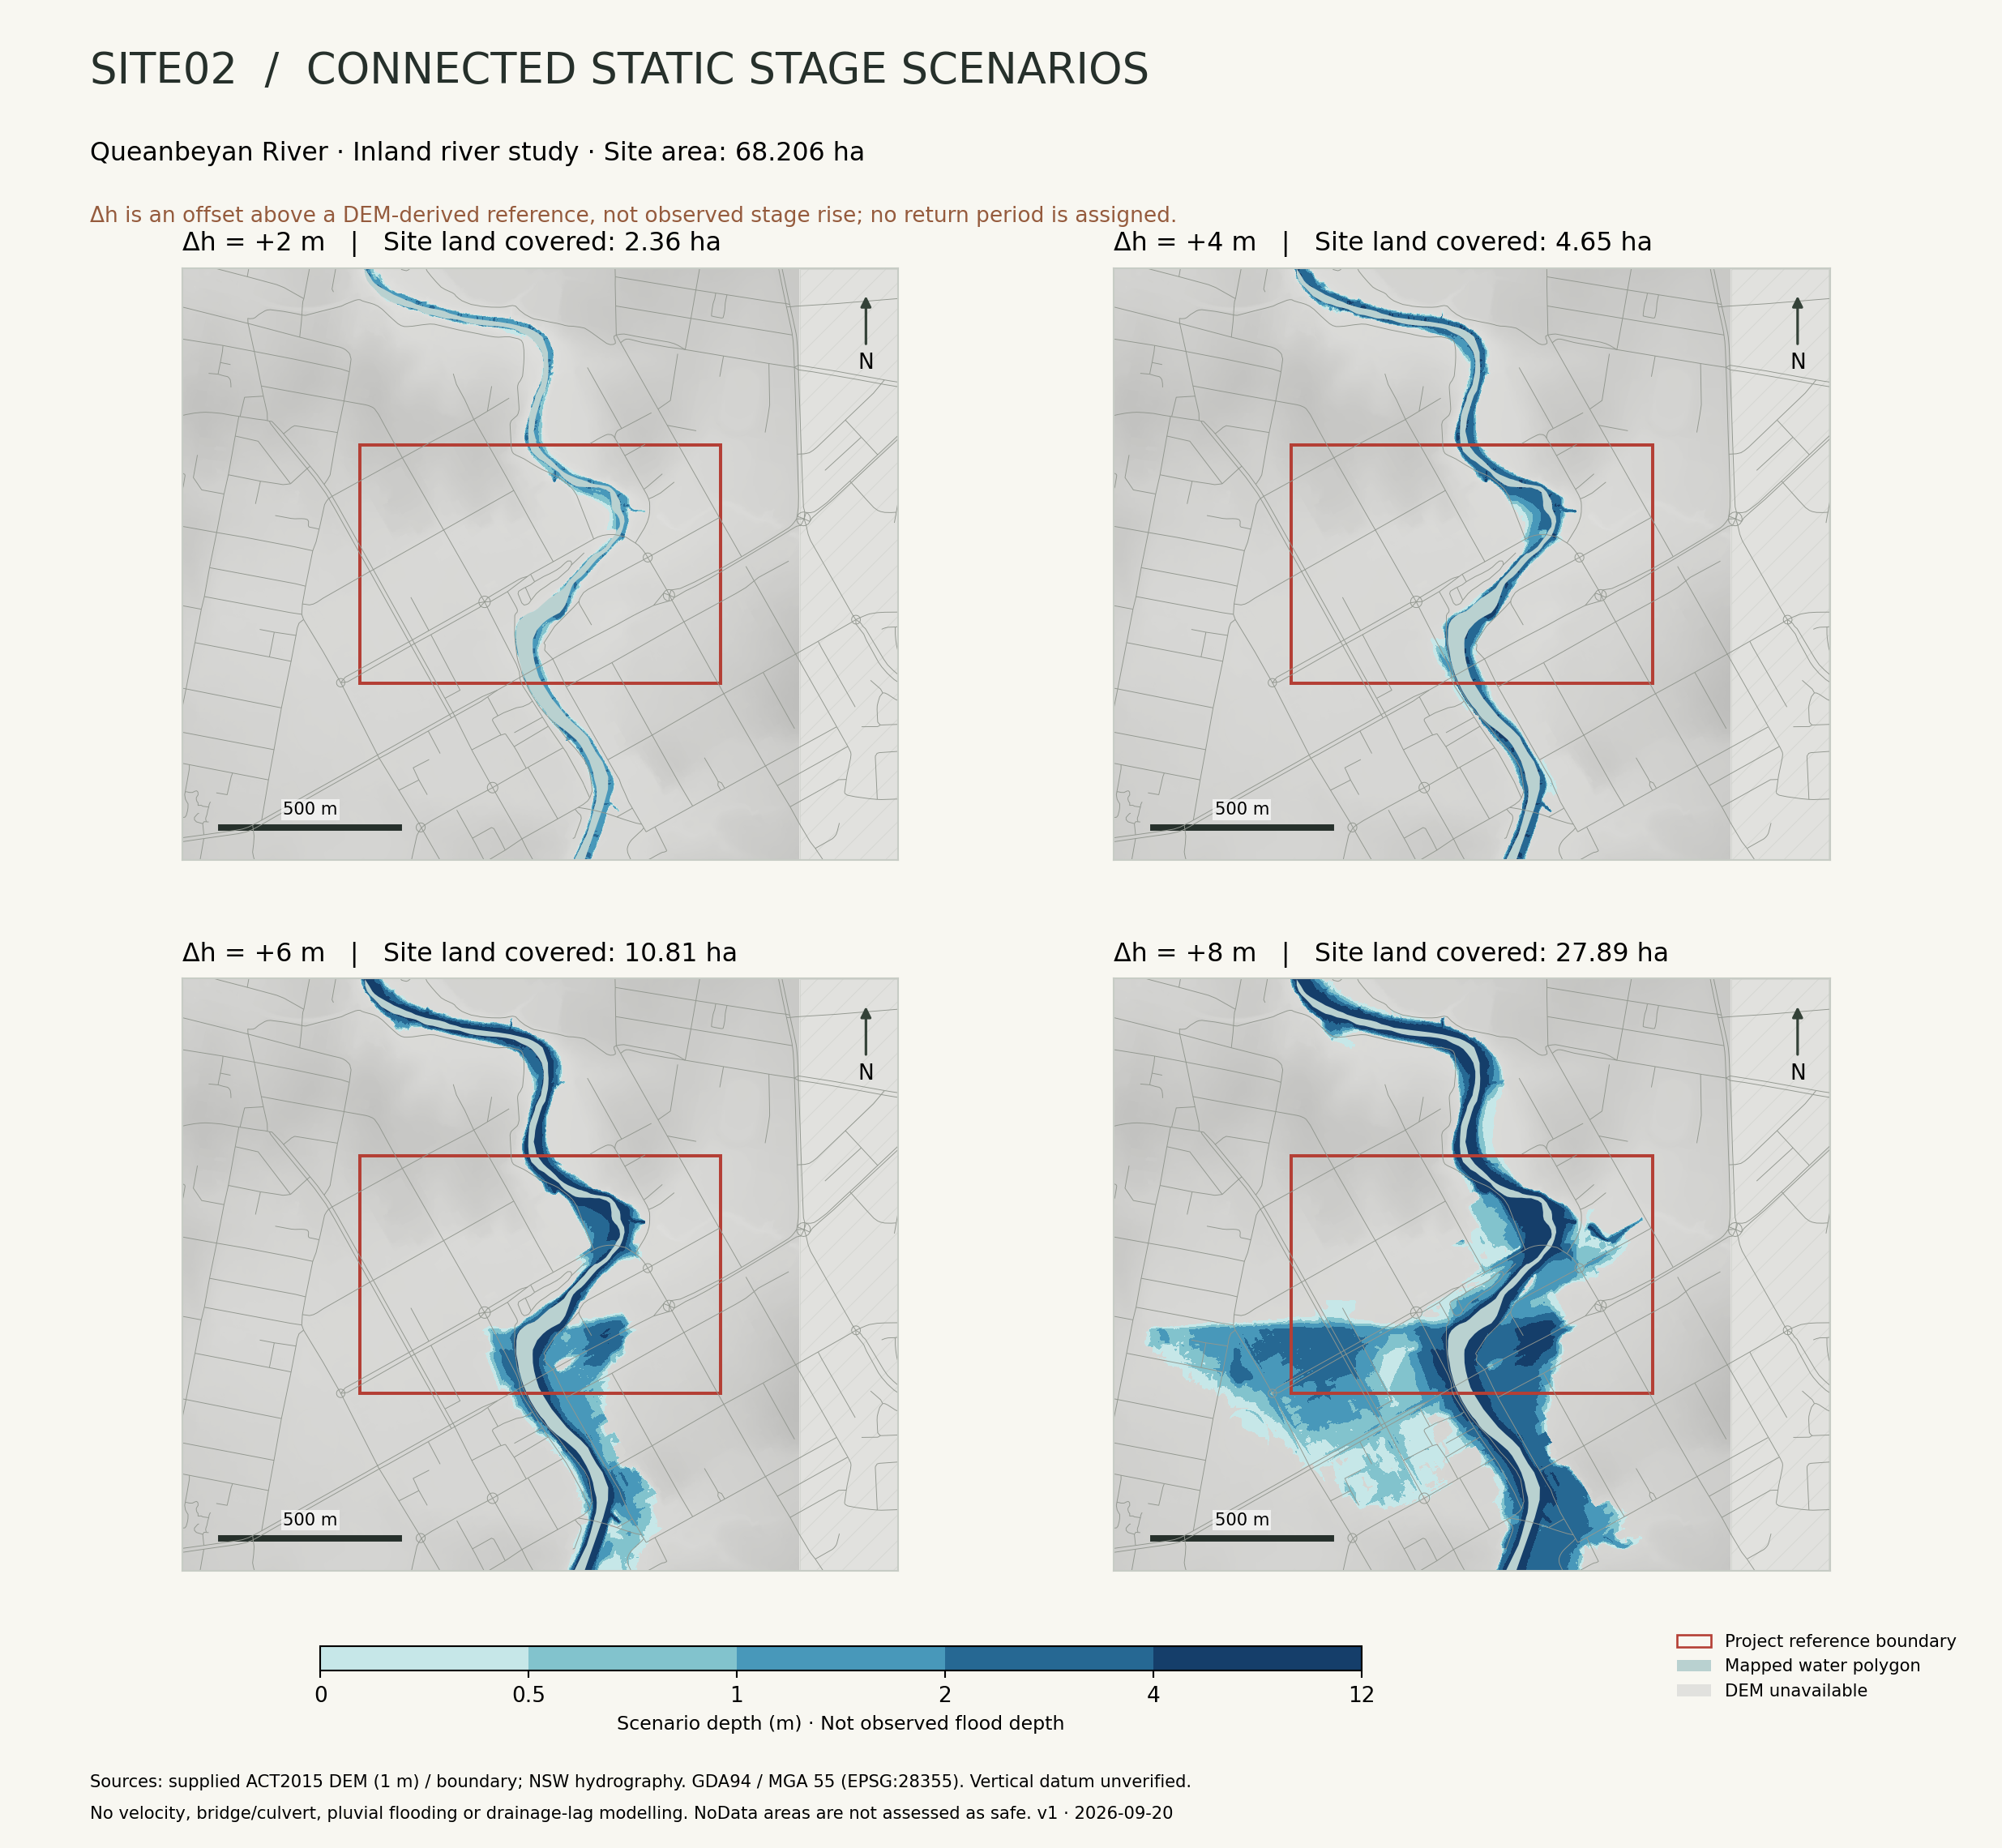
Explore an assumed seven-day rise and recession, regional climate horizons and official rainfall sensitivity maps. These are exploratory scenarios, not a forecast.
Seven-day river-stage scenario
Day 1 · 00:00 · Δh +0.0 m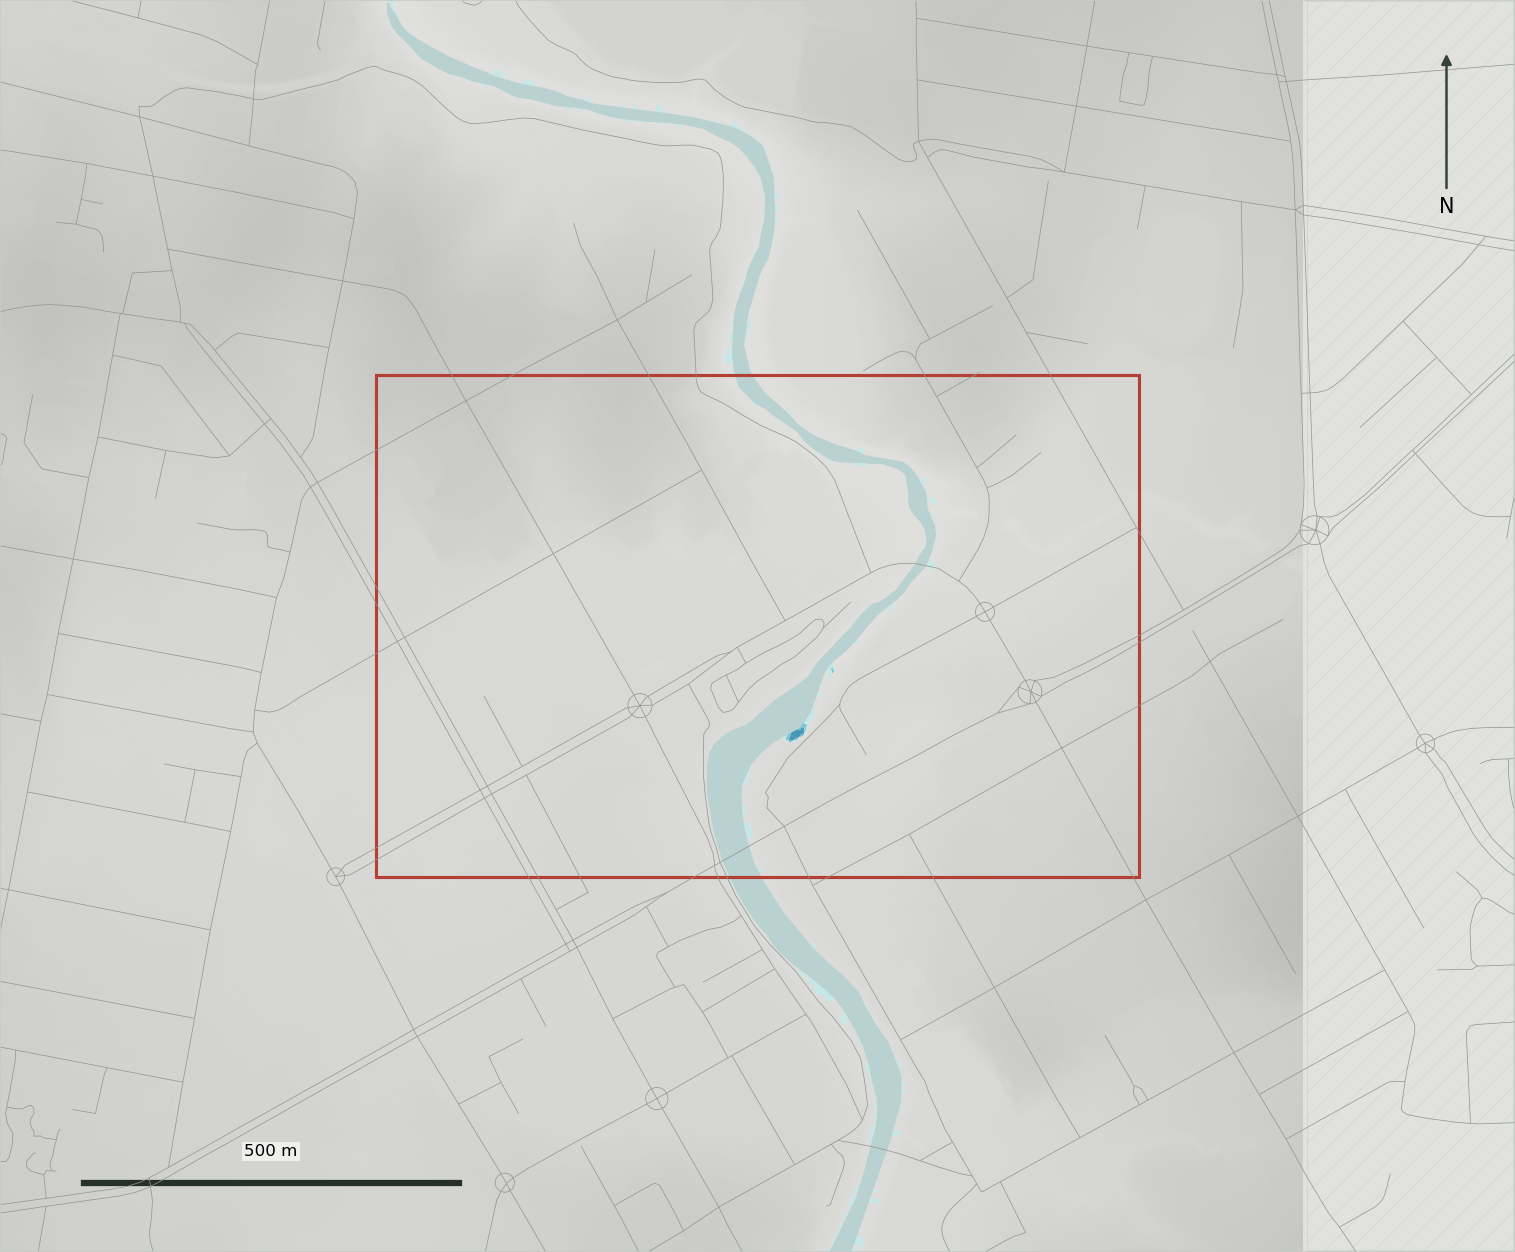
The map could not load. Open the static comparison figure.
Assumed reference-offset hydrograph
Piecewise linear · synthetic input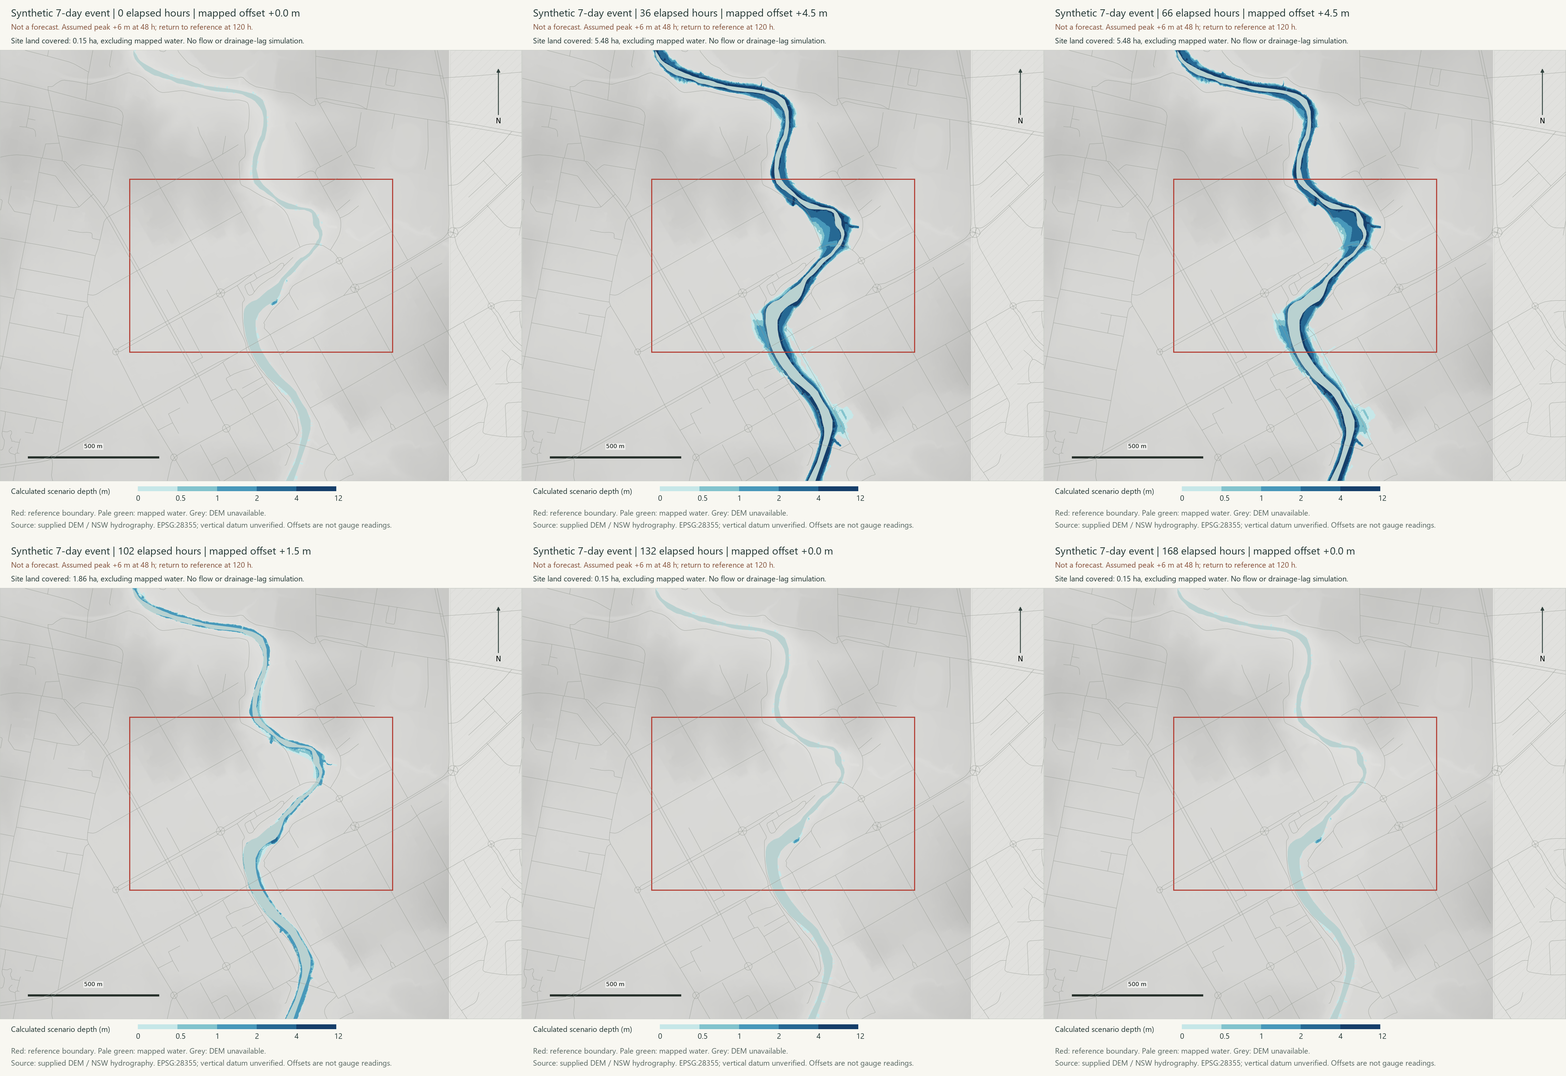
BOM forecasts at other upstream gauges are not Site02 inundation forecasts and are not imported into this model.
Longer horizons.
Different kinds of evidence.
Regional climate projections describe future background conditions. The official flood sensitivity maps test heavier design rainfall. Explore them separately: no verified year-to-flood-footprint conversion is available here.
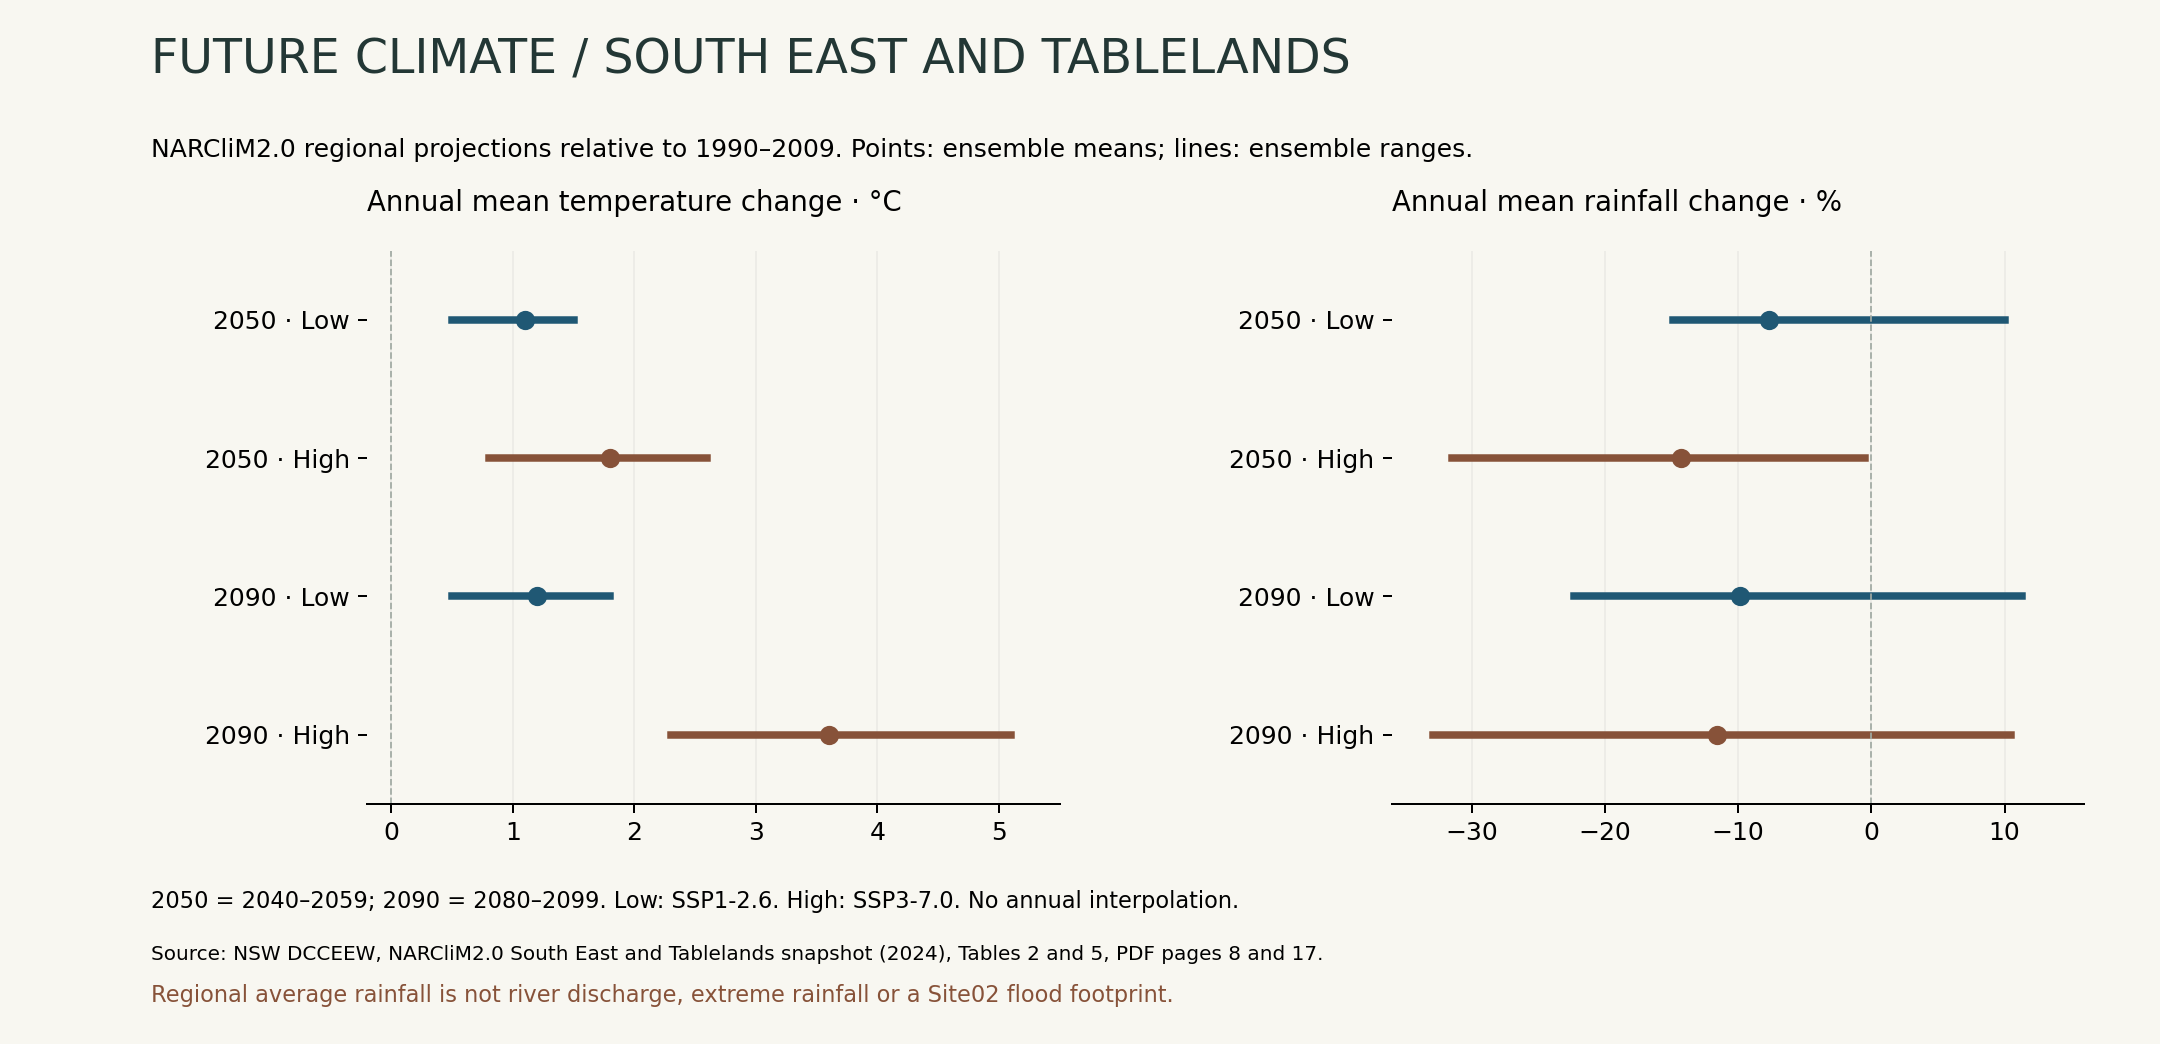
Annual mean temperature
Annual mean rainfall
South East and Tablelands regional averages, relative to 1990–2009. Low emissions: SSP1-2.6; high emissions: SSP3-7.0. Dots indicate ensemble means; horizontal lines show model ranges, not confidence intervals. Only the two published 20-year horizons are shown; no annual interpolation.
NARCliM2.0 snapshot · Tables 2 and 5 ↗How might heavier rainfall alter flooding?
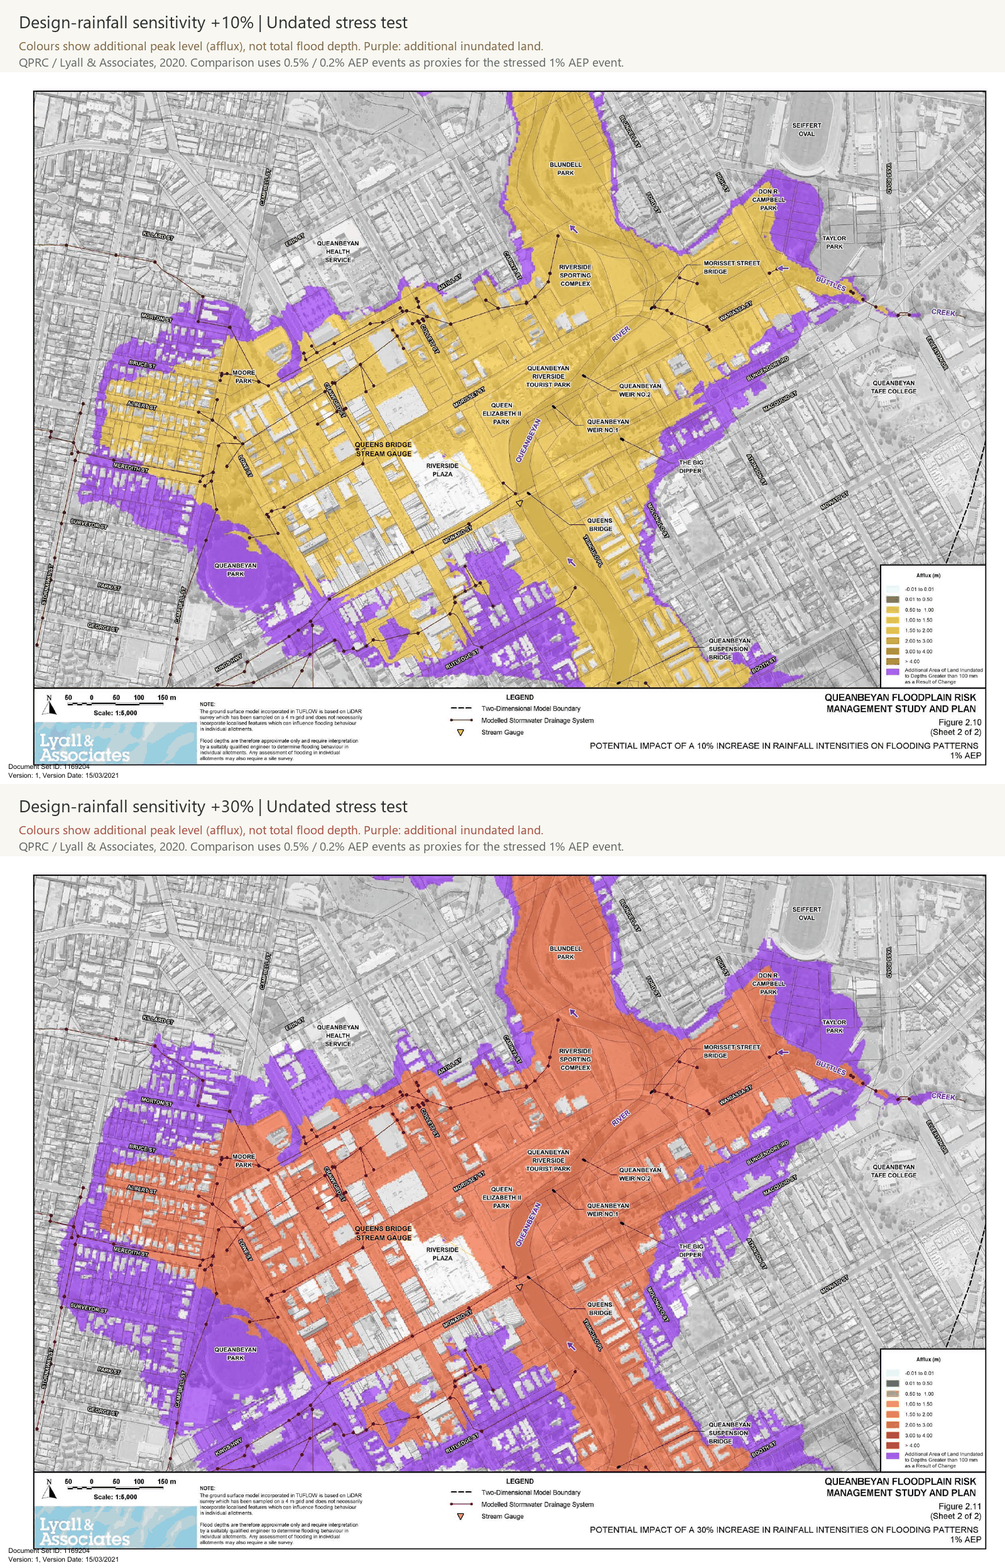
Official study · Section 2.10 ↗These are undated stress tests from the 2020 study, not forecasts for 2050 or 2090. Changing the climate horizon above does not change this map. The study uses the 0.5% and 0.2% AEP model events as proxies for a 1% AEP event with +10% and +30% design-rainfall intensity respectively.
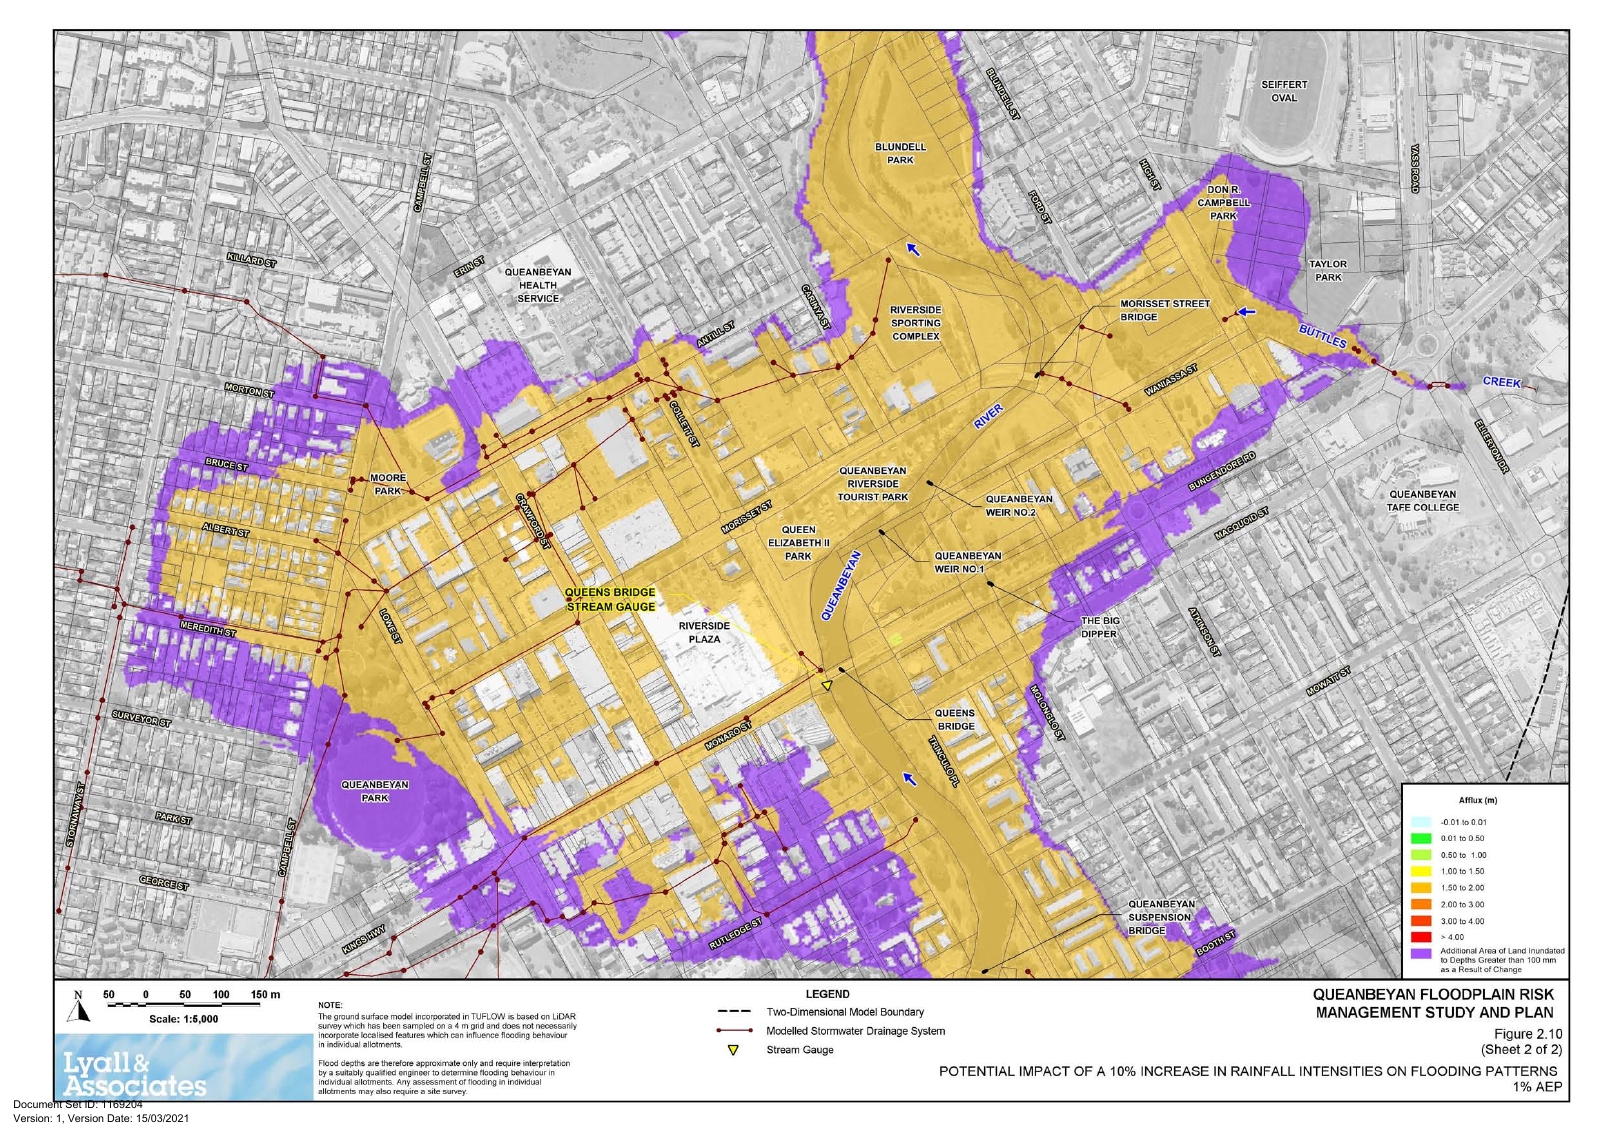
Figure 2.10, sheet 2 · Figures PDF page 20. © Queanbeyan-Palerang Regional Council 2020 / Lyall & Associates.
Questions for the river corridor
Compare additional inundation with access routes, riparian space and the existing observation atlas. Consider shade, refuge connectivity and room for floodwater as research questions. This page does not predict future populations or assign ecological damage to observed species.
What the maps hold fixed
River alignment, terrain and the supplied site boundary are held fixed. Erosion, sediment transport, bank migration, future development, restoration and dam-operation changes are not simulated. Lower regional average rainfall cannot be converted directly into a smaller channel or a lower flood peak.
Keep assumptions
visible.
The short-term animation is a controllable hypothesis. The long-term panels combine published climate evidence with separately labelled legacy flood sensitivity results.
Read methods, sources and limitationsHow the seven-day animation is calculated
The offset rises linearly from 0 to the selected peak, then falls linearly to 0 by the selected recovery time. At each hour it selects the nearest 0.5 m static map. The same offset has the same footprint during rising and falling stages; there is no retained-water or drainage-lag model.
These DEM scenarios have an unverified vertical datum and no calibrated relationship to discharge, rainfall, AEP or measured water level. Date labels do not turn them into a forecast.
Why there is no continuous 2030–2100 river prediction
The regional snapshot supplies 20-year climate summaries. It does not provide a dated Site02 hydraulic model or future channel geometry. No missing years, future river positions or site water depths have been invented.
Climate projection and flood sensitivity are distinct
NARCliM2.0 mean-rainfall projections are not extreme-rainfall adjustments. The official 2020 sensitivity maps use an older proxy method. A current engineering study would need updated rainfall guidance, hydrology, terrain, channel and structure data, dam operation and hydraulic calibration.
Australian Rainfall and Runoff · climate-change update ↗Sources and reuse
NARCliM2.0 South East and Tablelands snapshot, NSW DCCEEW, 2024, Tables 2 and 5. QPRC floodplain study, 2020, Section 2.10 and Figures 2.10–2.11. Supplied Site02 boundary and ACT2015 DEM; source occurrence atlas is available in the Ecology section above.
Complete source and licence catalogue