River, ecology
& future scenarios
Explore water-level sensitivity, recorded species, historical floods and future scenarios within one Site02 research atlas.
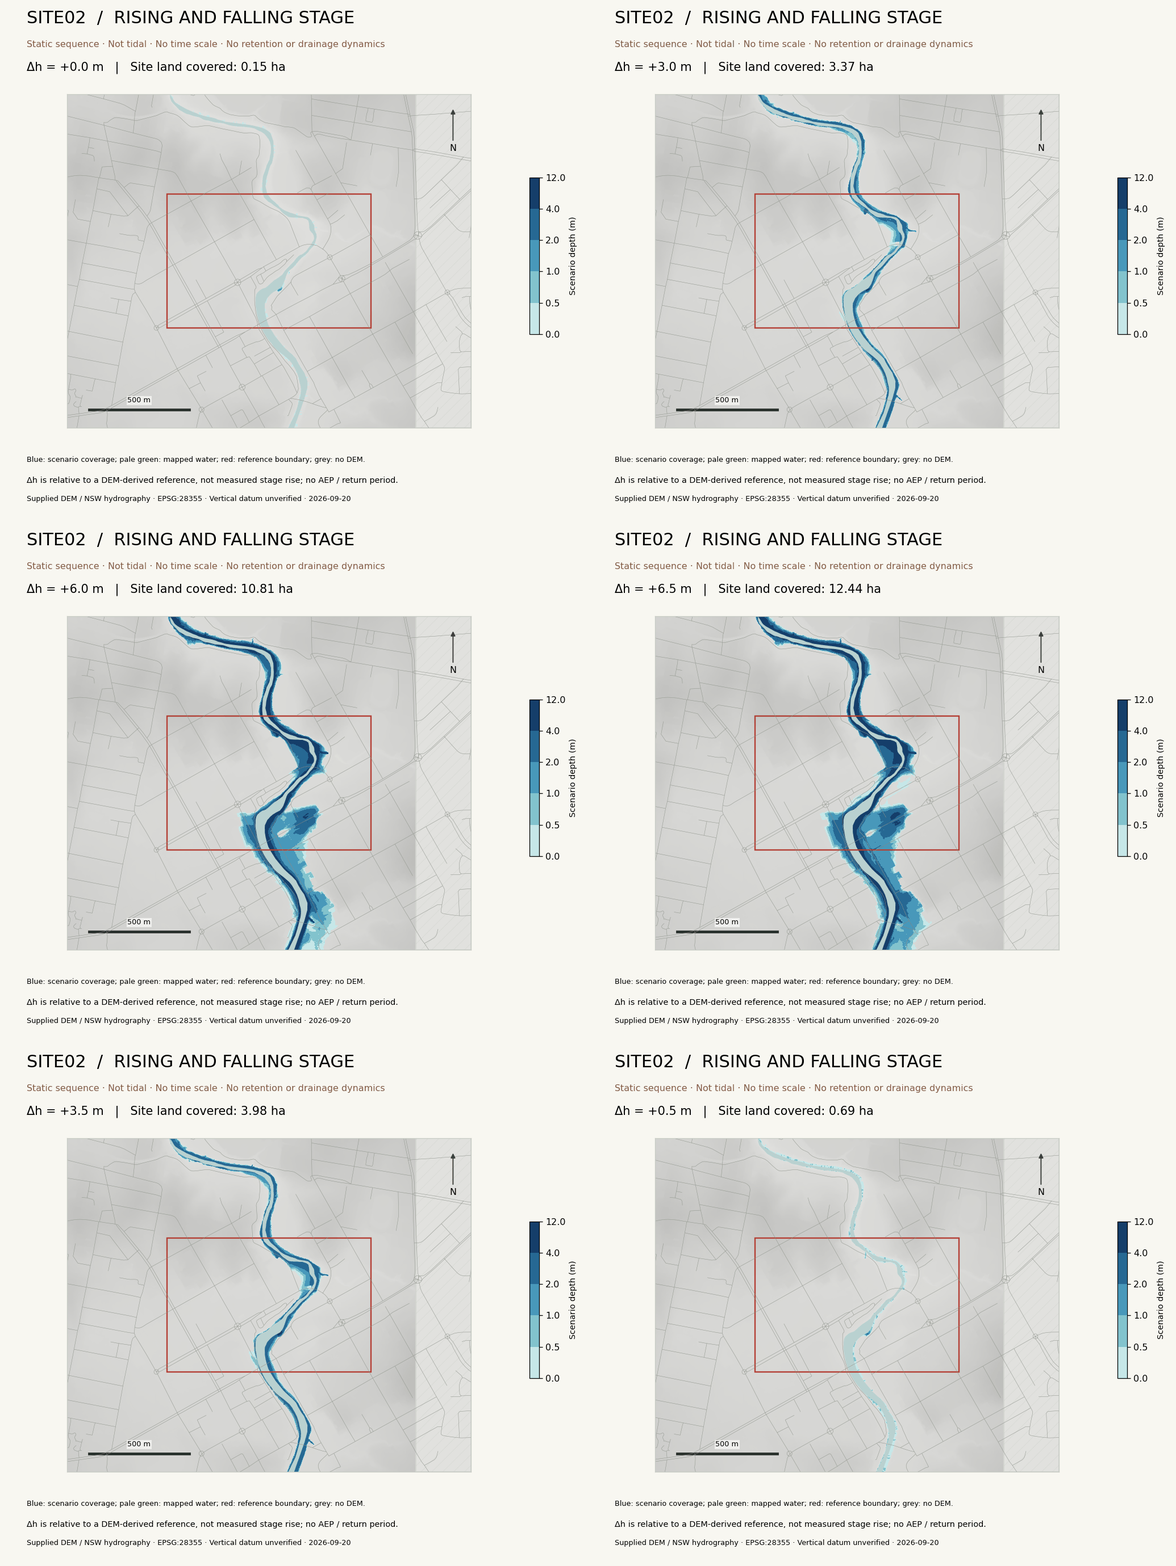
Figure 1. Connected stage scenarios
Reference offset Δh = +4.0 m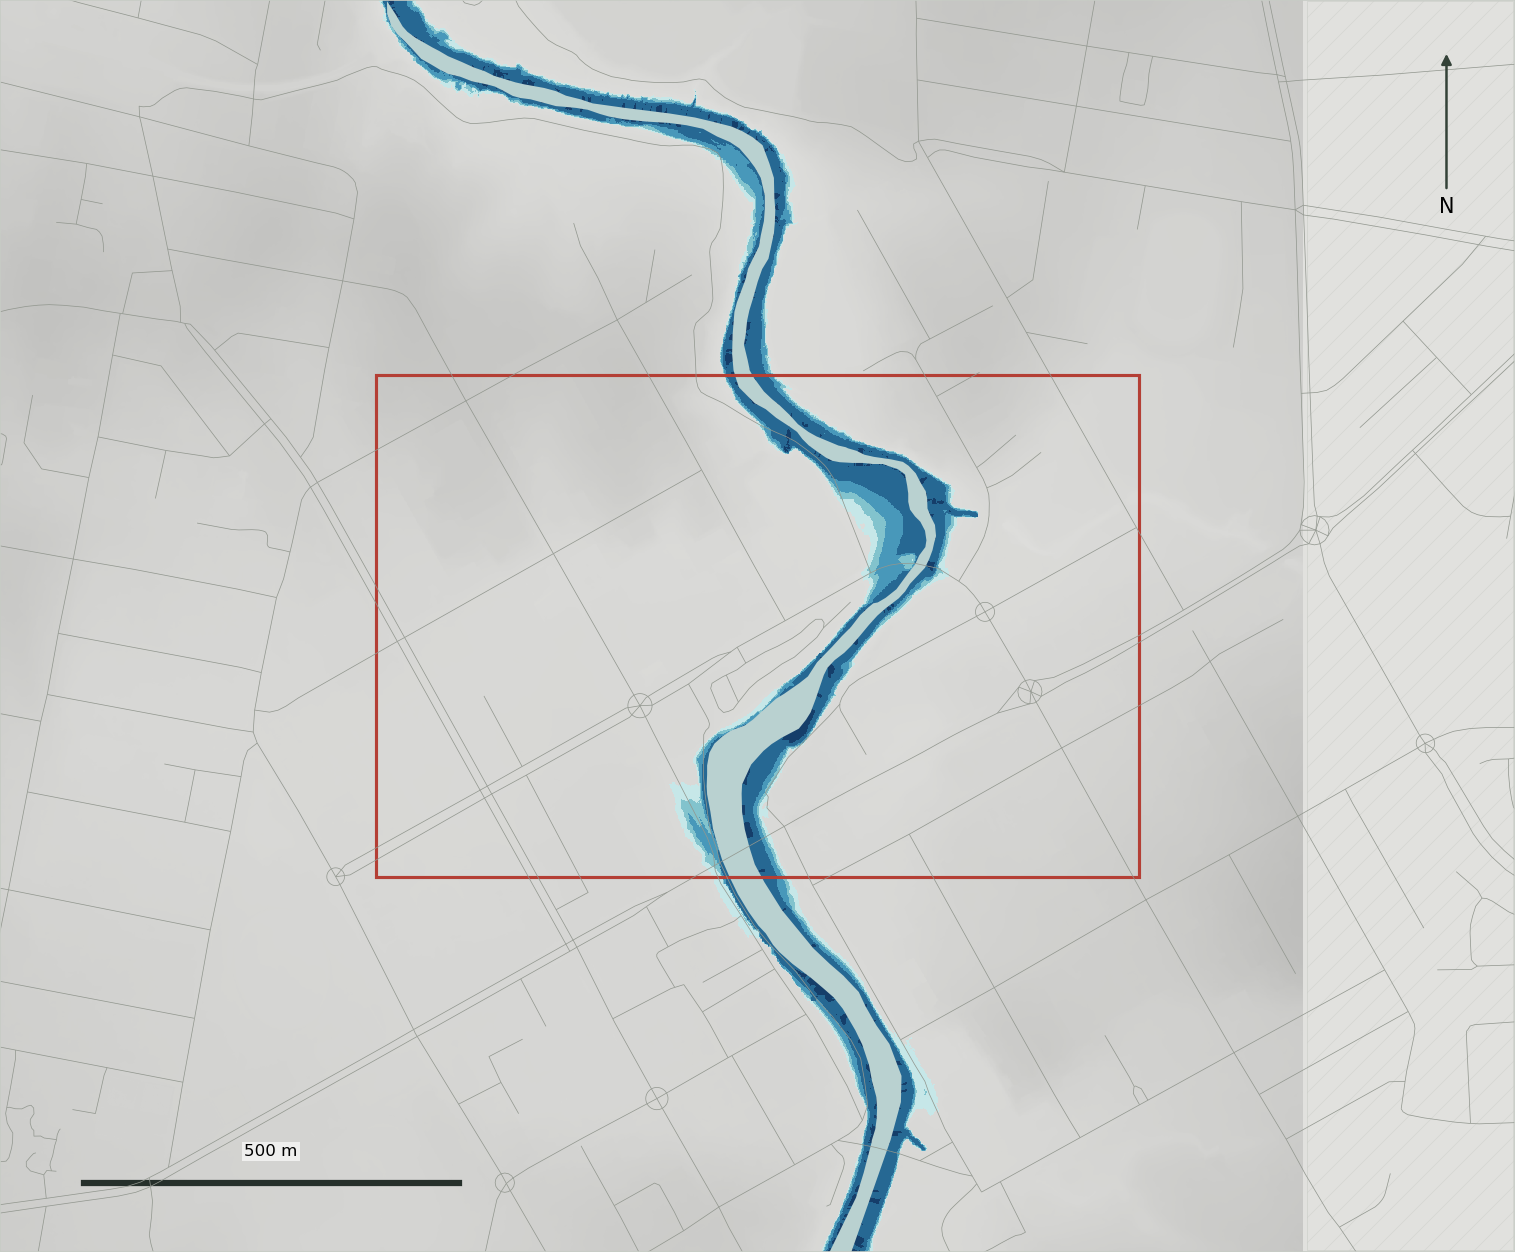
The map image could not be displayed. Reload the file or open the standalone comparison figure.
Open comparison figure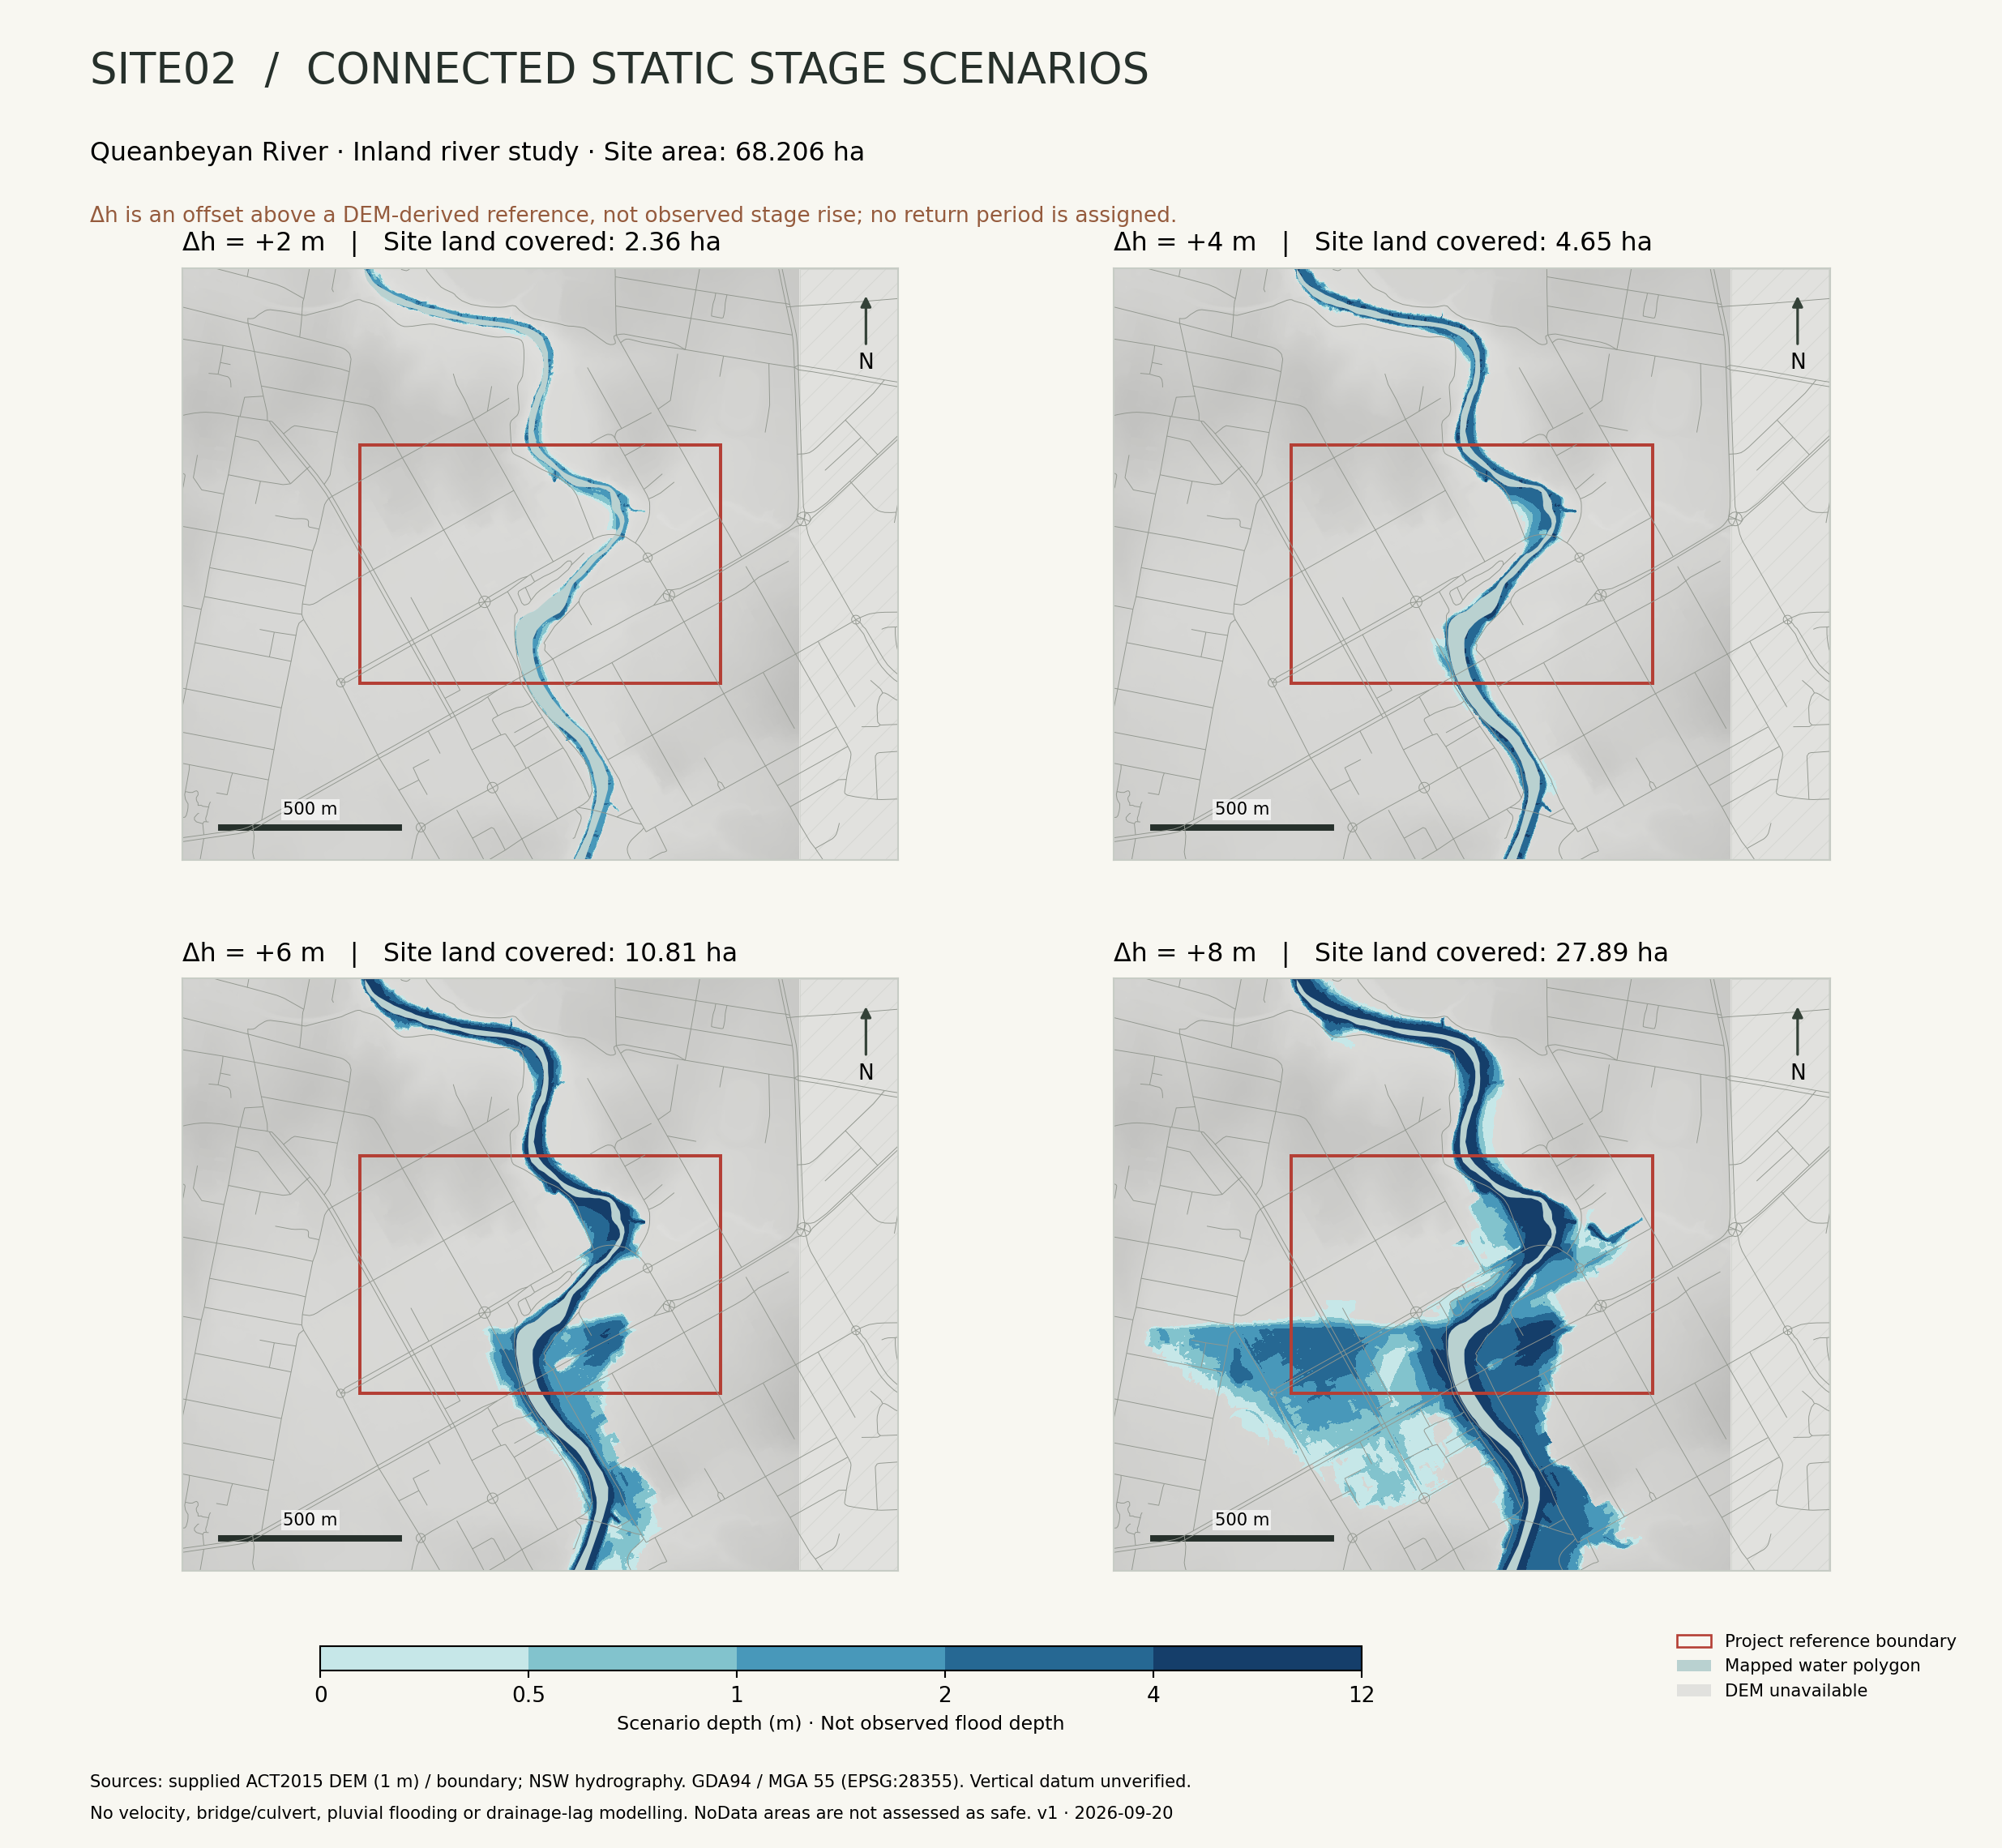
Ecological evidence,
at two spatial scales.
The 2 km site buffer contains 3,435 retained observations and 371 distinct taxon labels, including 327 at species rank. These are records of presence, not an inventory of individuals or a complete habitat survey.
Locate the records. Inspect the evidence.
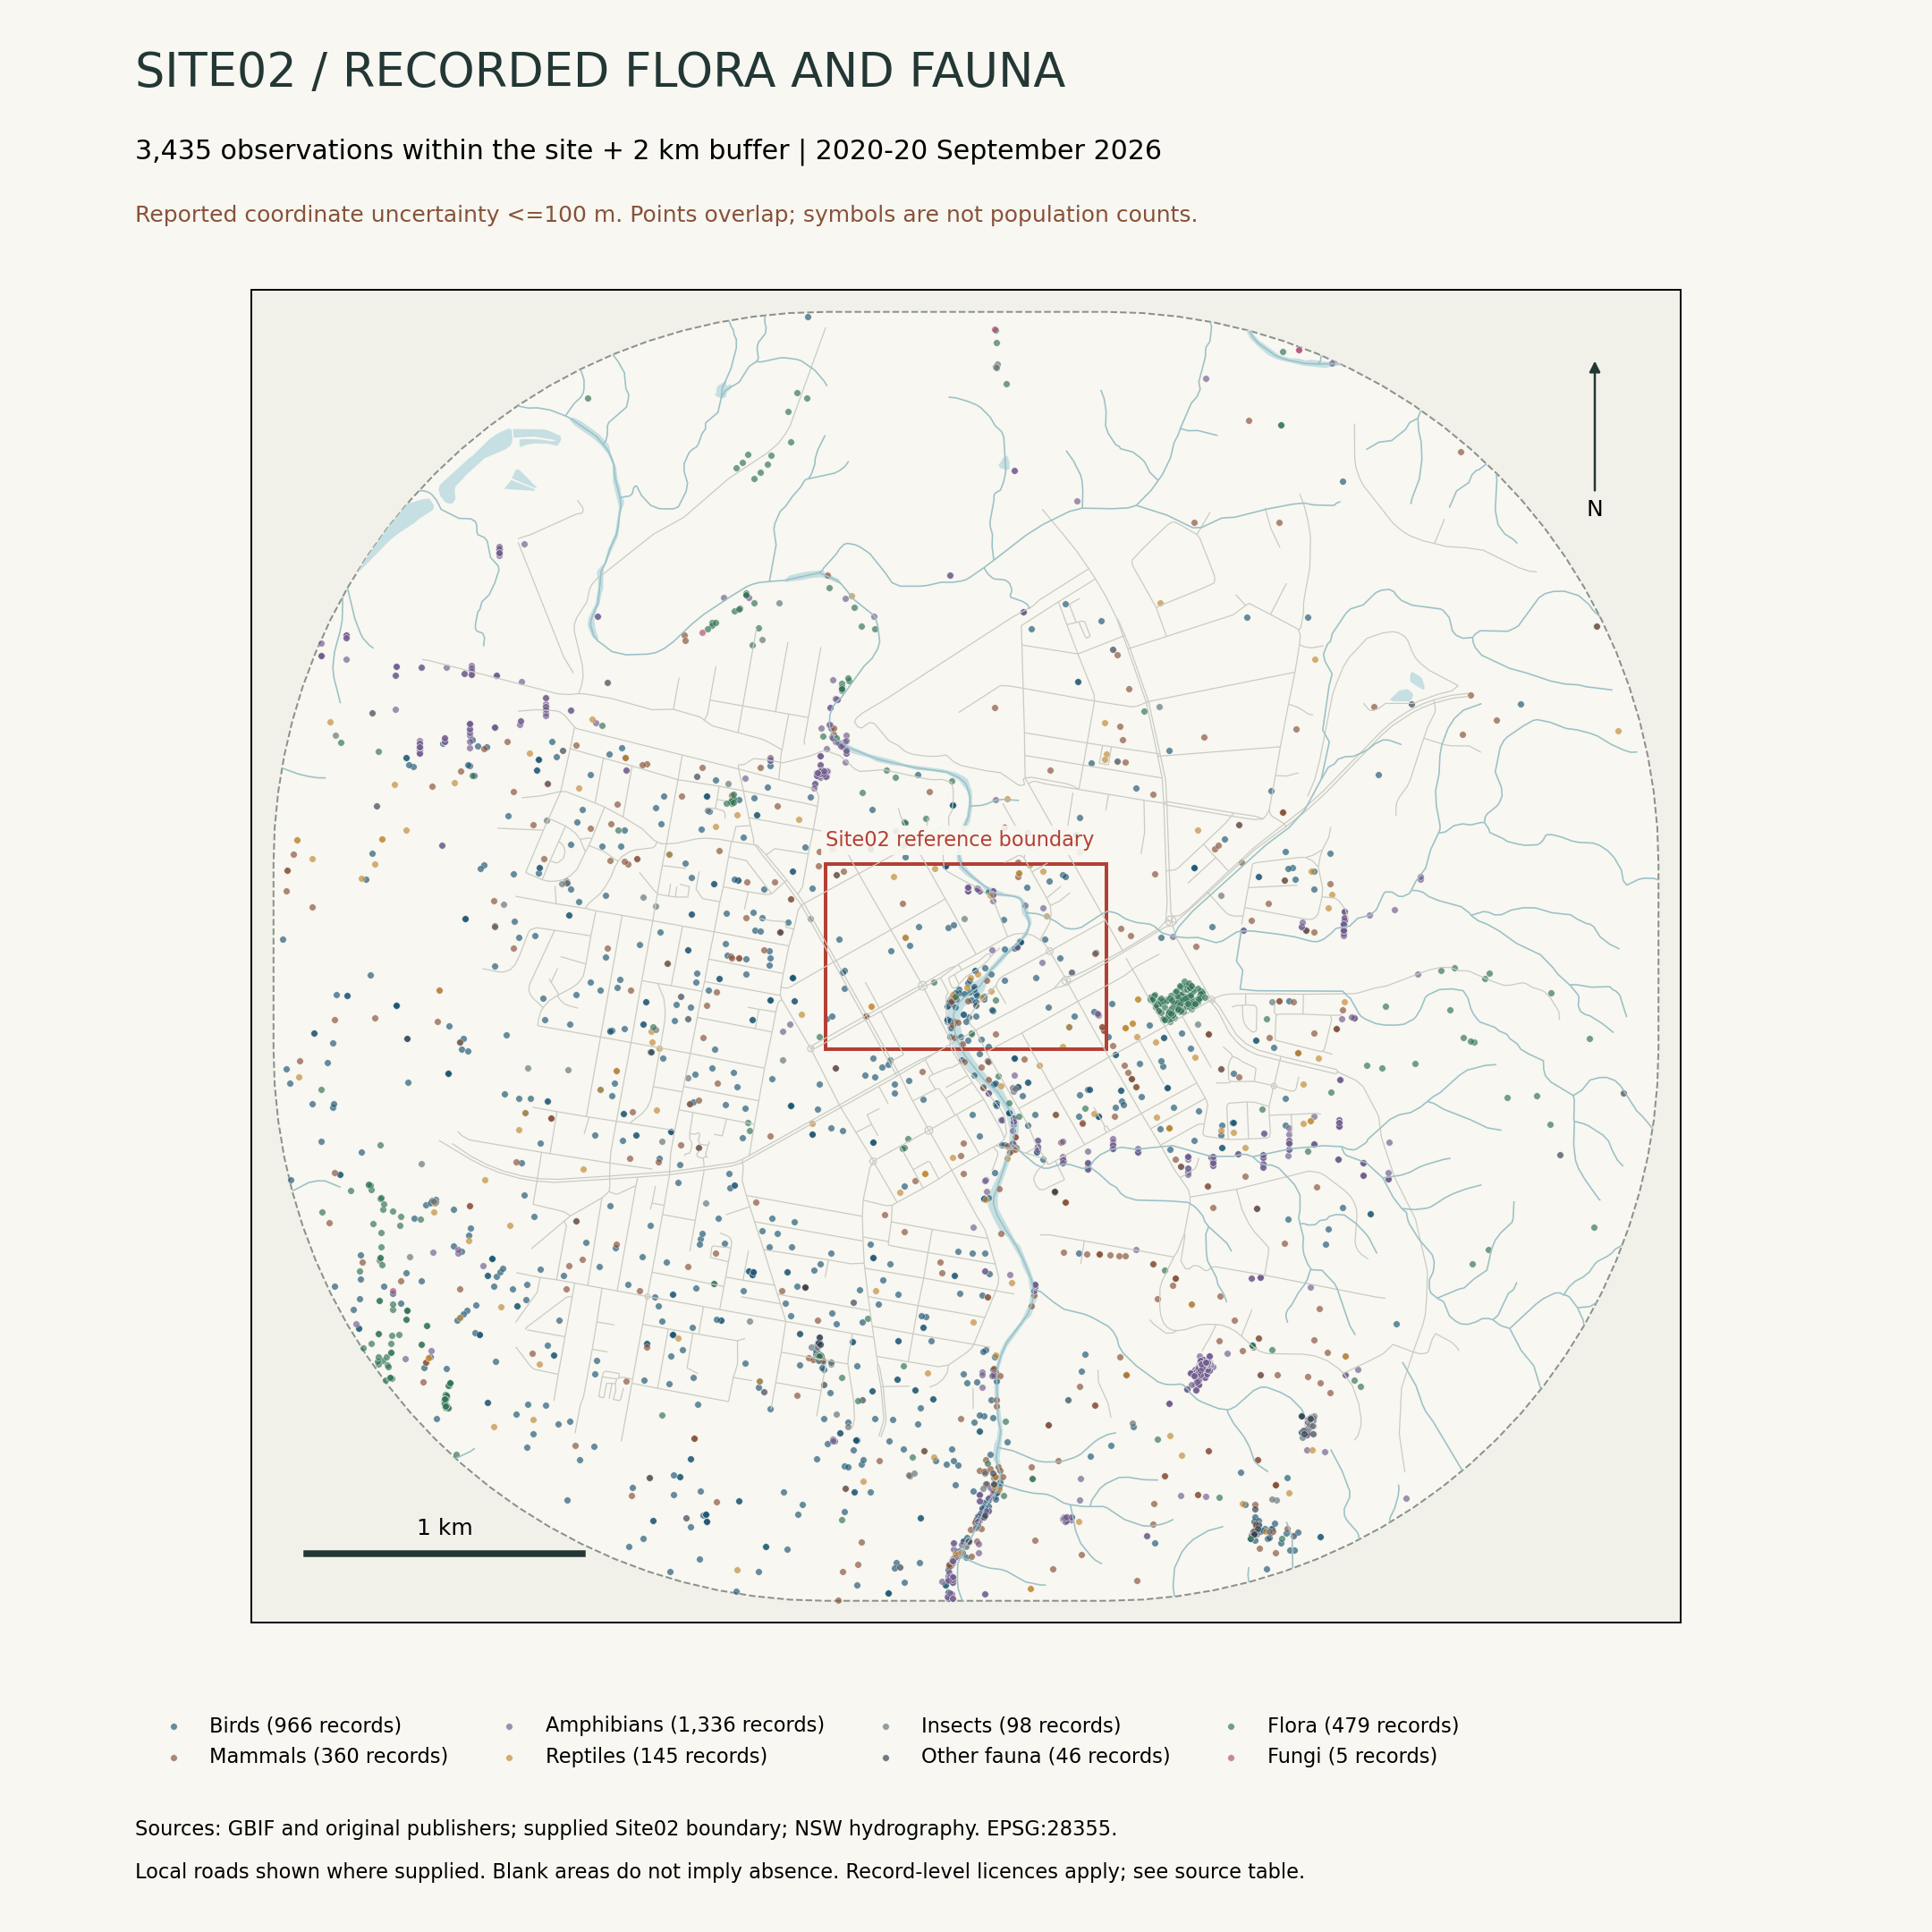
3,435 records · 371 taxon labels · 212 records inside Site02
Community overlay: ochre = PCT 3376; dark green = PCT 4085; grey-green = other native communities. Hover over a polygon for its name. Unclassified land is not necessarily unvegetated.
GDA94 / MGA zone 55 (EPSG:28355); north is up. All points retain their reported locations, including overlaps. Context hydrography and local roads are shown where supplied; blank areas do not indicate absence.
Compare observations in the 500 m context grid
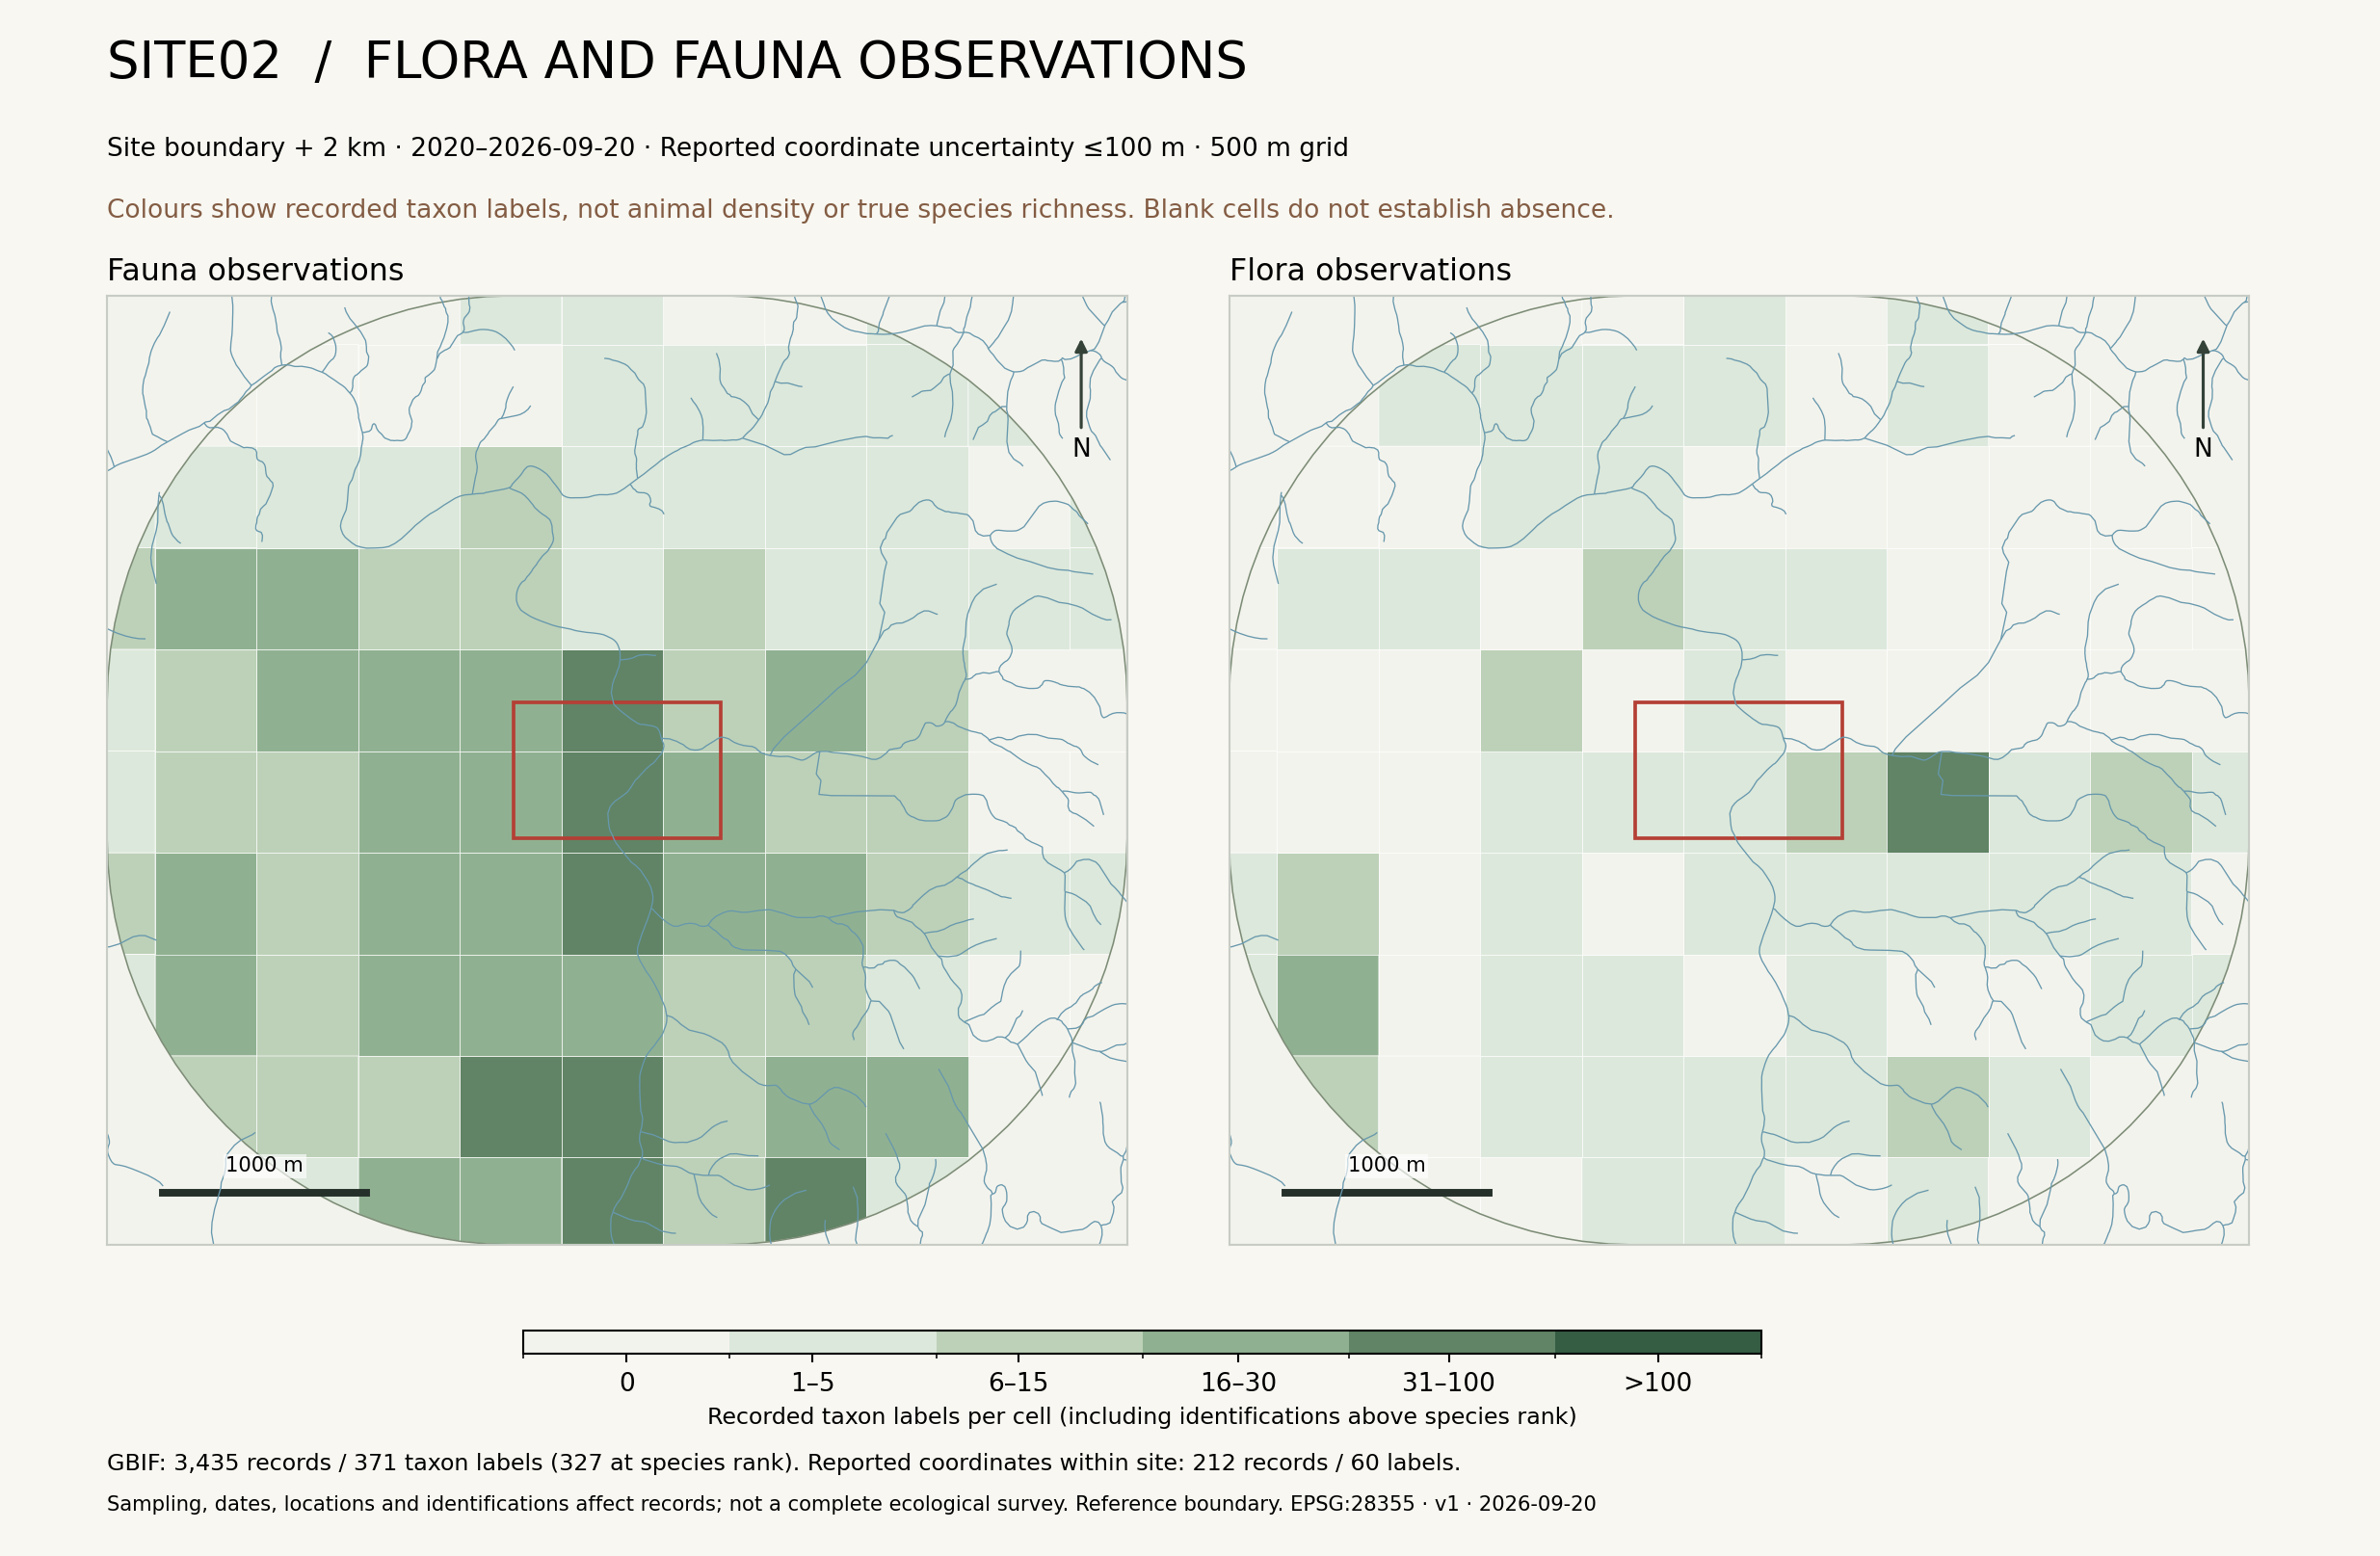
Reading the observation record
Sampling effort, season, location accuracy and identification affect the map. Darker cells should not be interpreted as higher actual population density or biodiversity.
Only five retained plant records have reported coordinates inside the site. A field botanical survey is needed to describe its plant community.
| Taxon | 2 km buffer | Within site |
|---|---|---|
| PlatypusOrnithorhynchus anatinus | 28 records | 3 records |
| RakaliHydromys chrysogaster | 18 records | 7 records |
Site membership uses reported coordinates. Counts are not numbers of individuals, and points do not identify burrows.
A landscape with
a longer history.
Official extant and reconstructed pre-clearing vegetation maps provide context for the river corridor. Community polygons are regional classifications; they are not individual-tree surveys.
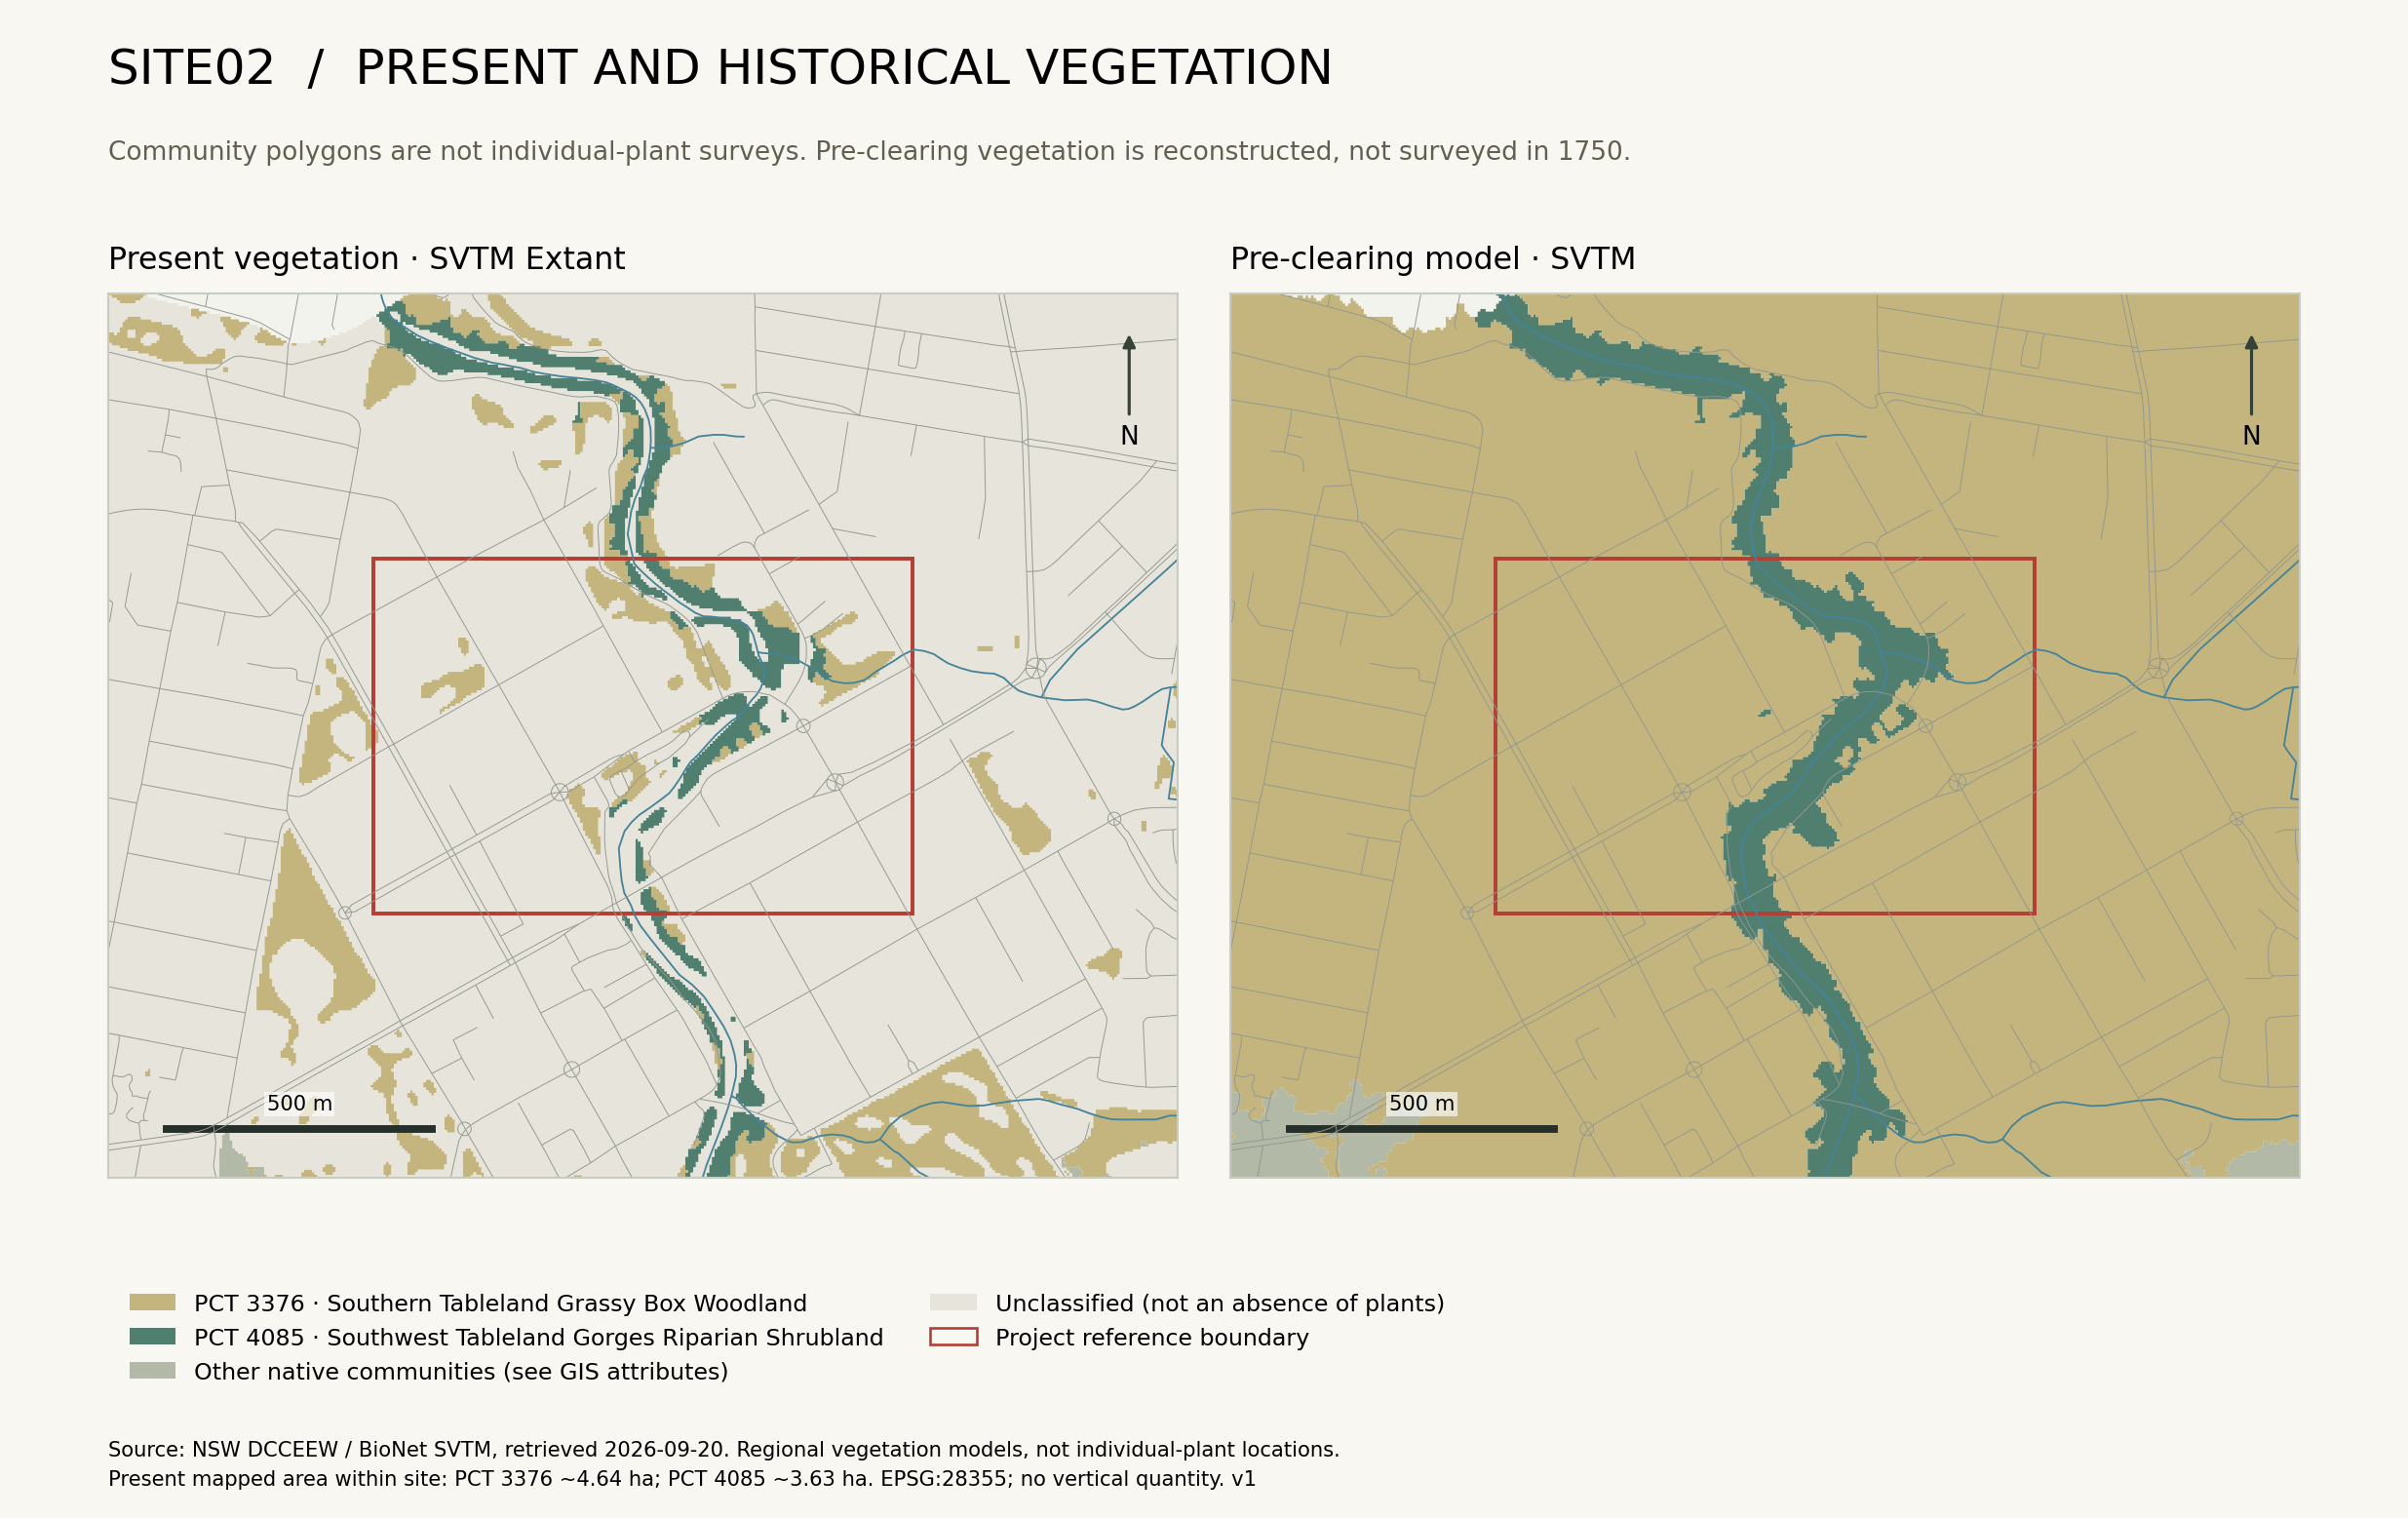
From community to corridor
Compare these mapped communities with historic aerial imagery and field observations. Separate vegetation removal, changes in species composition and differences in what a map classifies.
| Plant Community Type | Extant | Pre-clearing model |
|---|---|---|
| PCT 3376Southern Tableland Grassy Box Woodland | 4.64 ha | 59.83 ha |
| PCT 4085Southwest Tableland Gorges Riparian Shrubland | 3.63 ha | 8.38 ha |
Different model definitions and uncertainties prevent a direct, precise interpretation as vegetation loss.
A river with
a flood history.
Four historical events, reconstructed in the official 2020 study. Play through their peak-condition maps, then explore the documented rise and recession in December 2010.
May 1925 · official peak reconstruction
Figure C2.3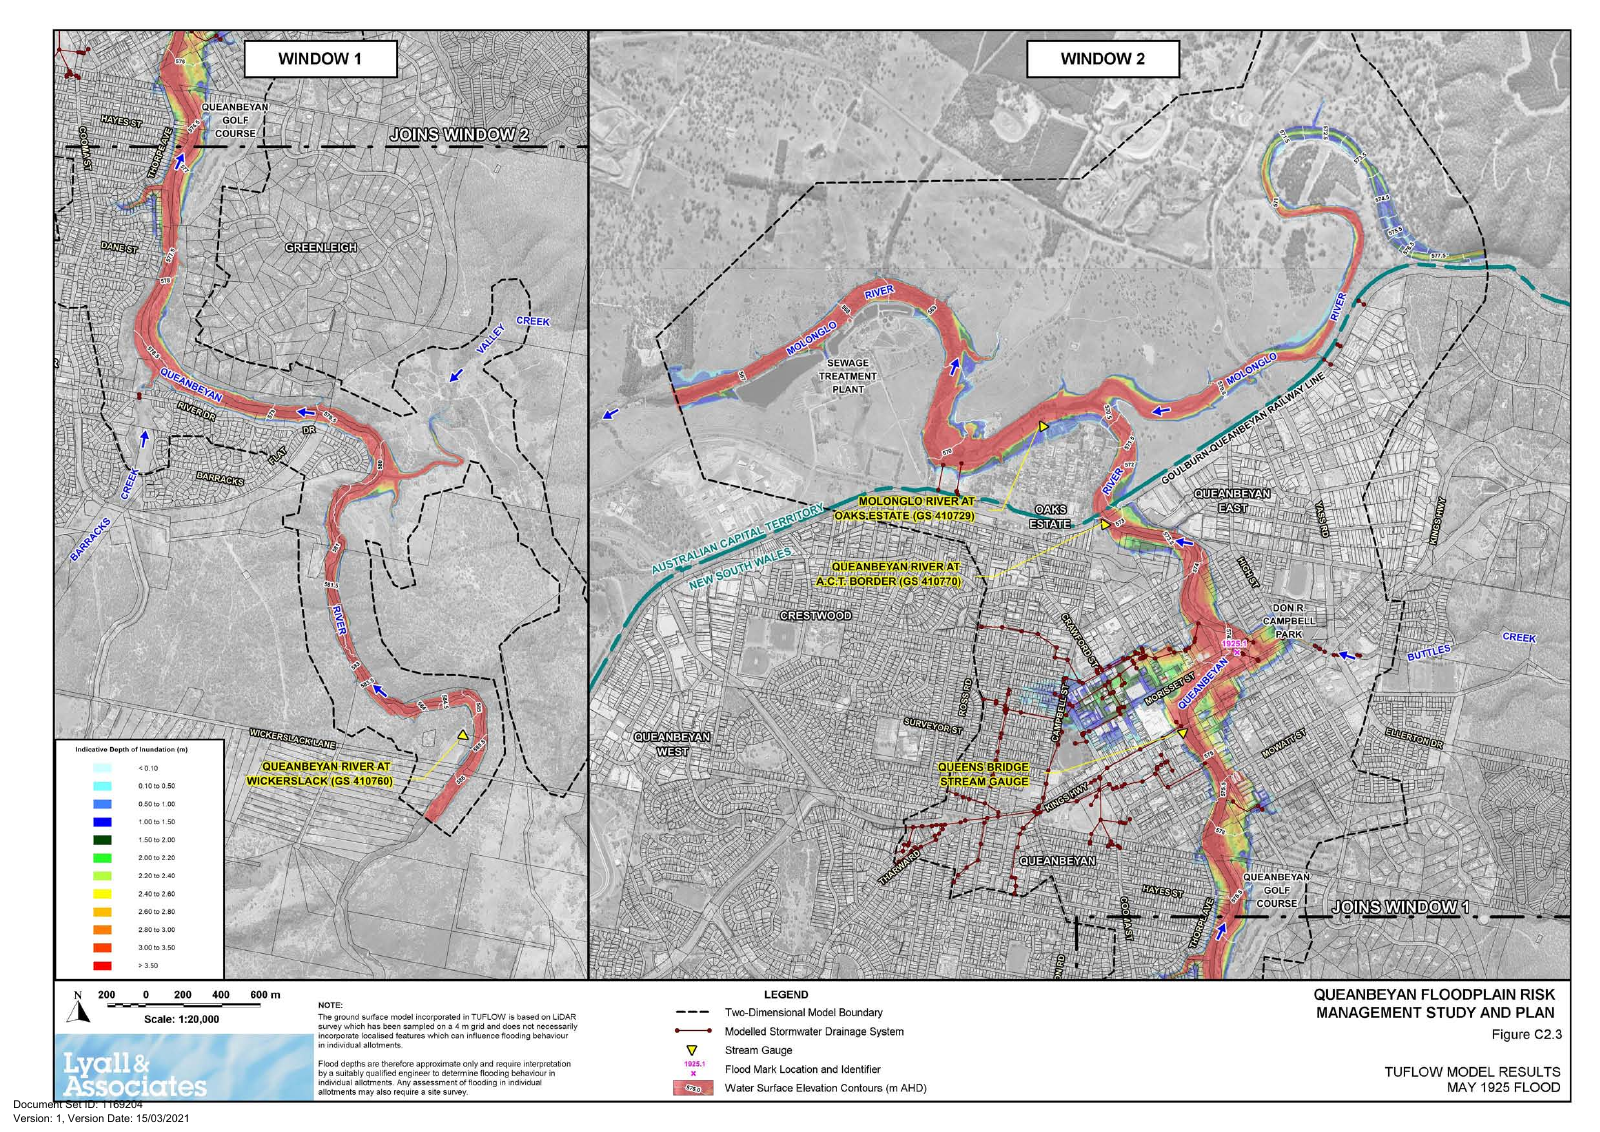
© Queanbeyan-Palerang Regional Council 2020; prepared by Lyall & Associates. Original map geometry, legends and source notices retained. See the complete source figures and reuse notes.
Reading this reach
Use Morisset Street, Buttles Creek and Queens Bridge as shared landmarks. The source maps show the corridor around Site02, including riverfront land and urban drainage connections. Inspect the enlarged 2010 sheet for local flood-mark evidence.
What changes across events
Compare modelled peak extent and depth alongside each event’s gauge height and dam context. A difference between maps cannot be attributed to one cause alone. Recent species records do not establish which organisms were affected by historical floods.
A rapid rise, followed by recession.
Discrete values reported in Section 2.4.8, PDF page 27. The horizontal axis represents elapsed time; the animation advances only between documented milestones.
Reported gauge stage. The available text supplies selected milestones, not a continuous measured hydrograph.
The final downward symbol means below 4.2 m, not a measured value of exactly 4.2 m. The map at right shows the peak reconstruction throughout; it is not a changing footprint for these times.
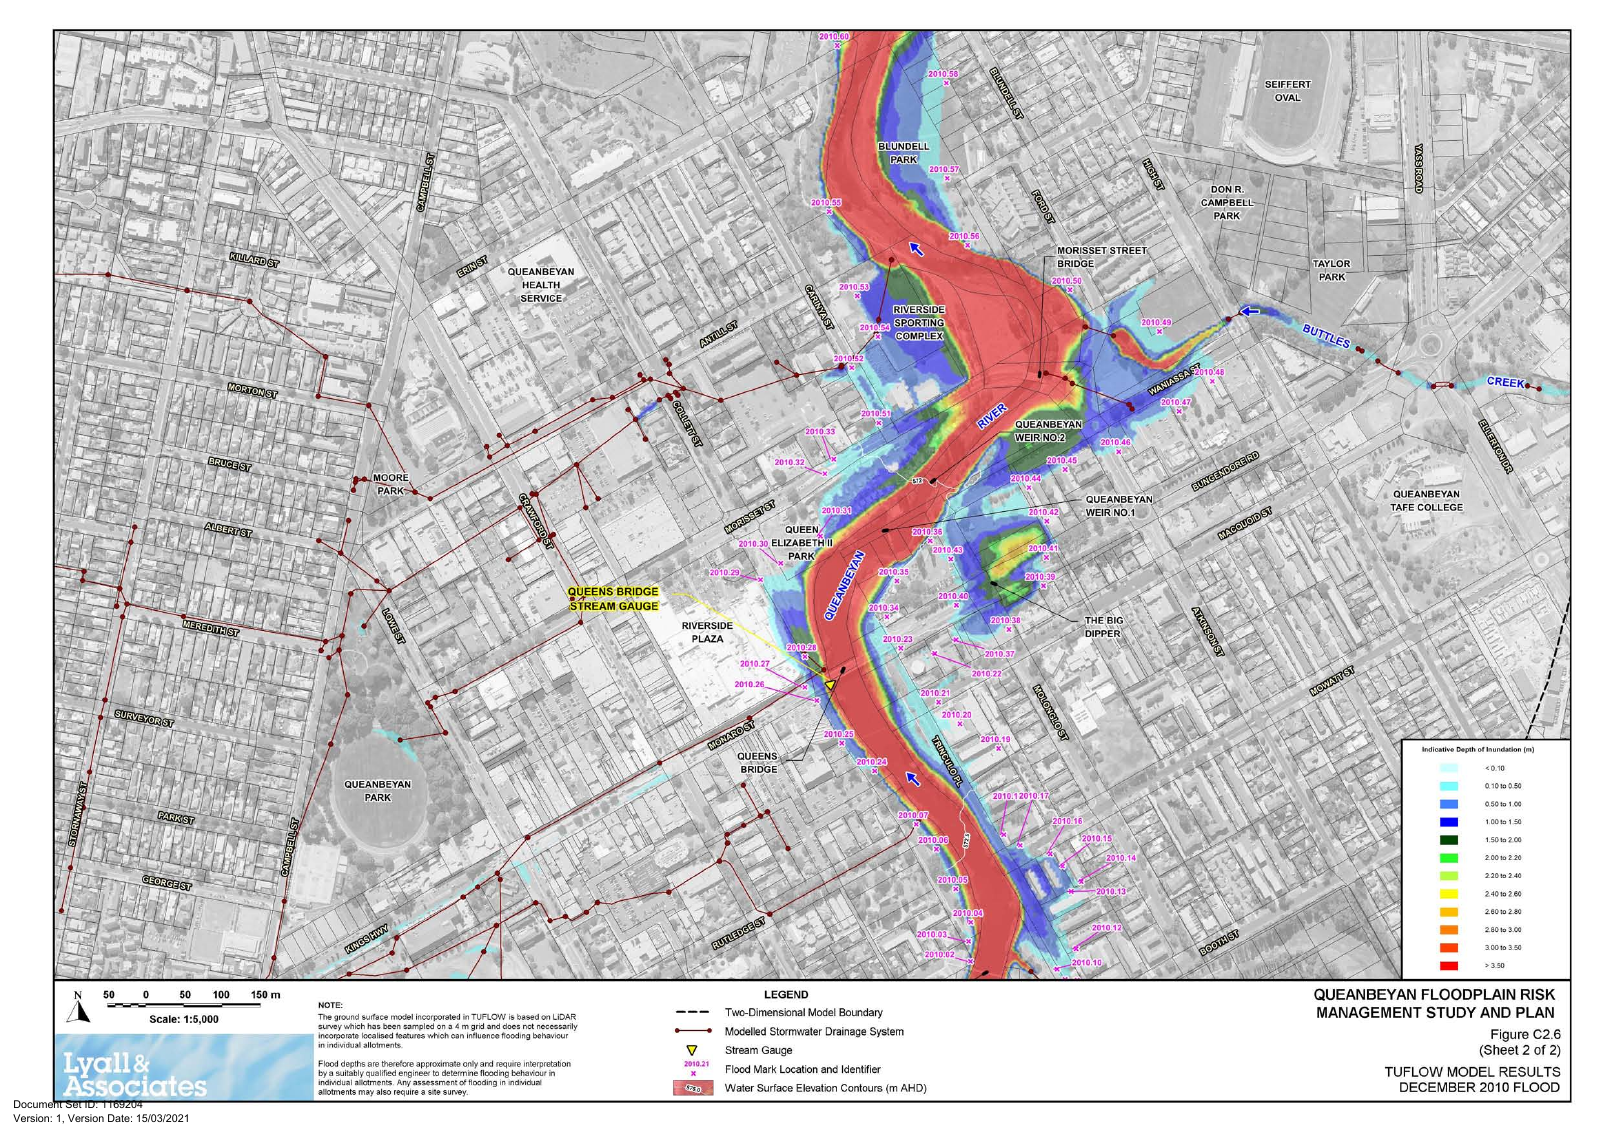
The river,
over time.
Explore an assumed seven-day rise and recession, regional climate horizons and official rainfall sensitivity maps. These are exploratory scenarios, not a forecast.
Seven-day river-stage scenario
Day 1 · 00:00 · Δh +0.0 m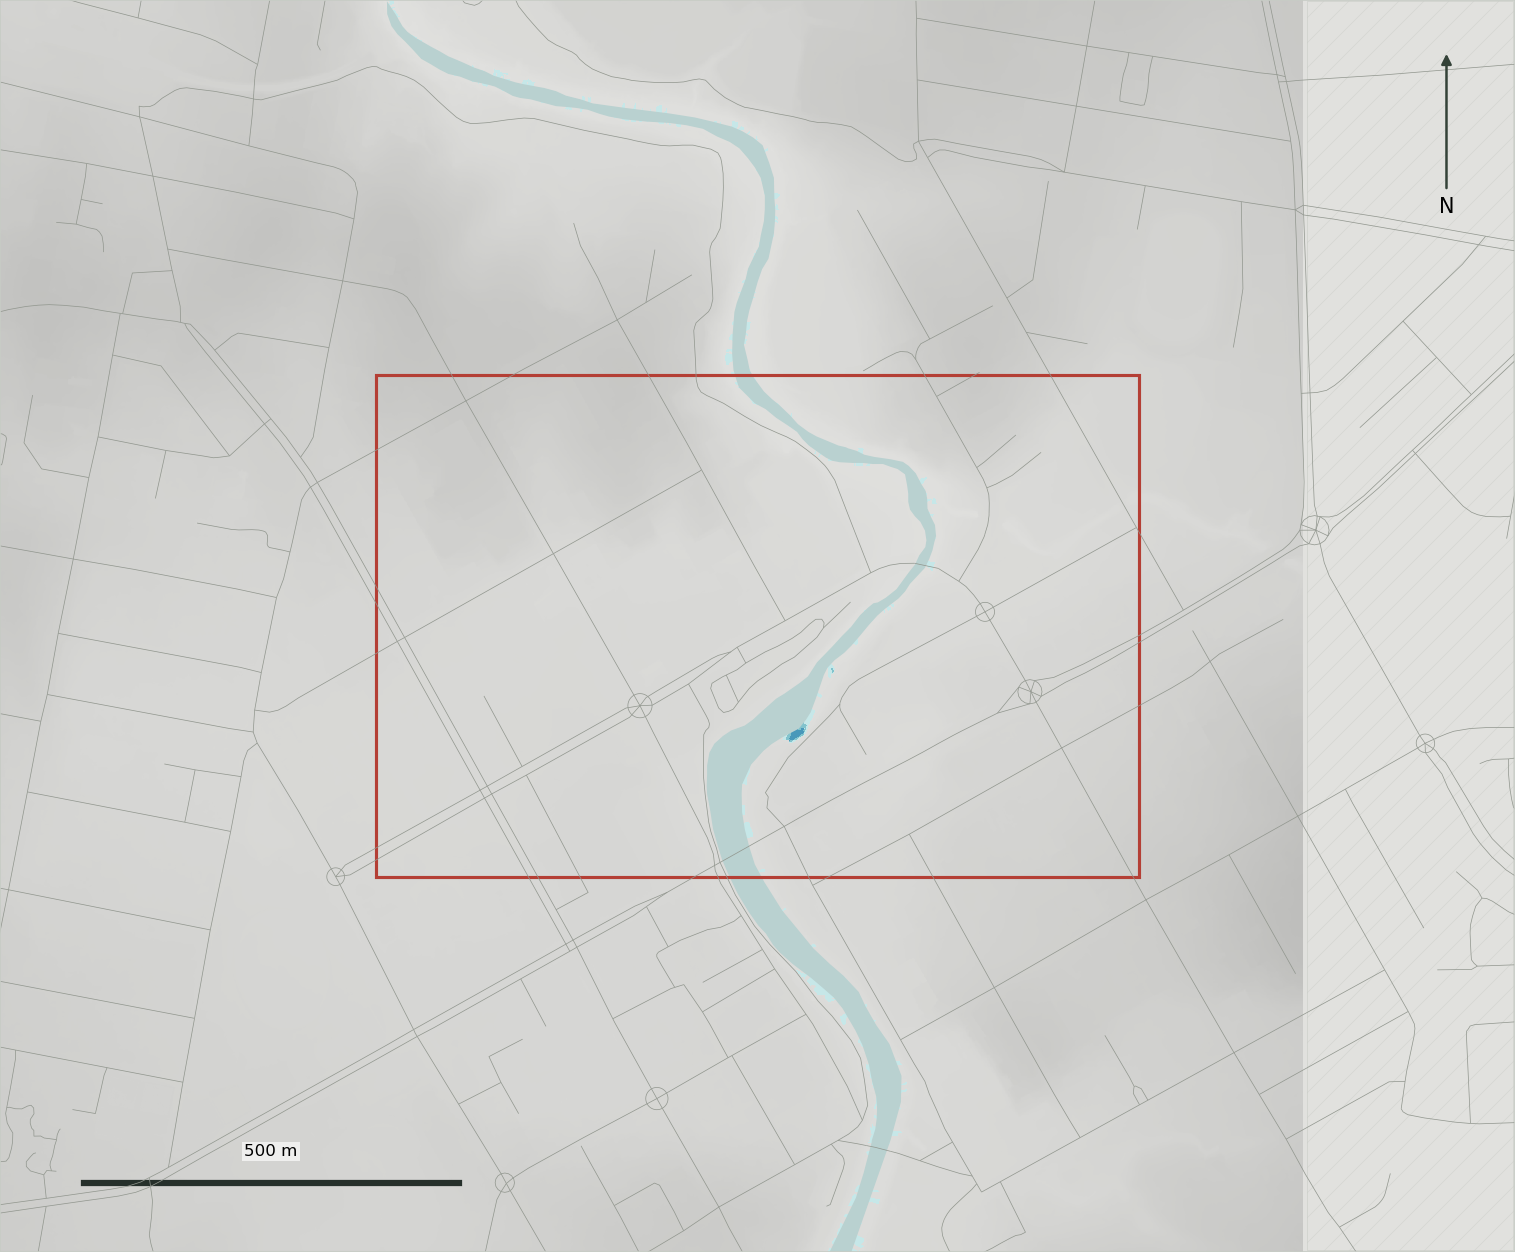
The map could not load. Open the static comparison figure.
Assumed reference-offset hydrograph
Piecewise linear · synthetic input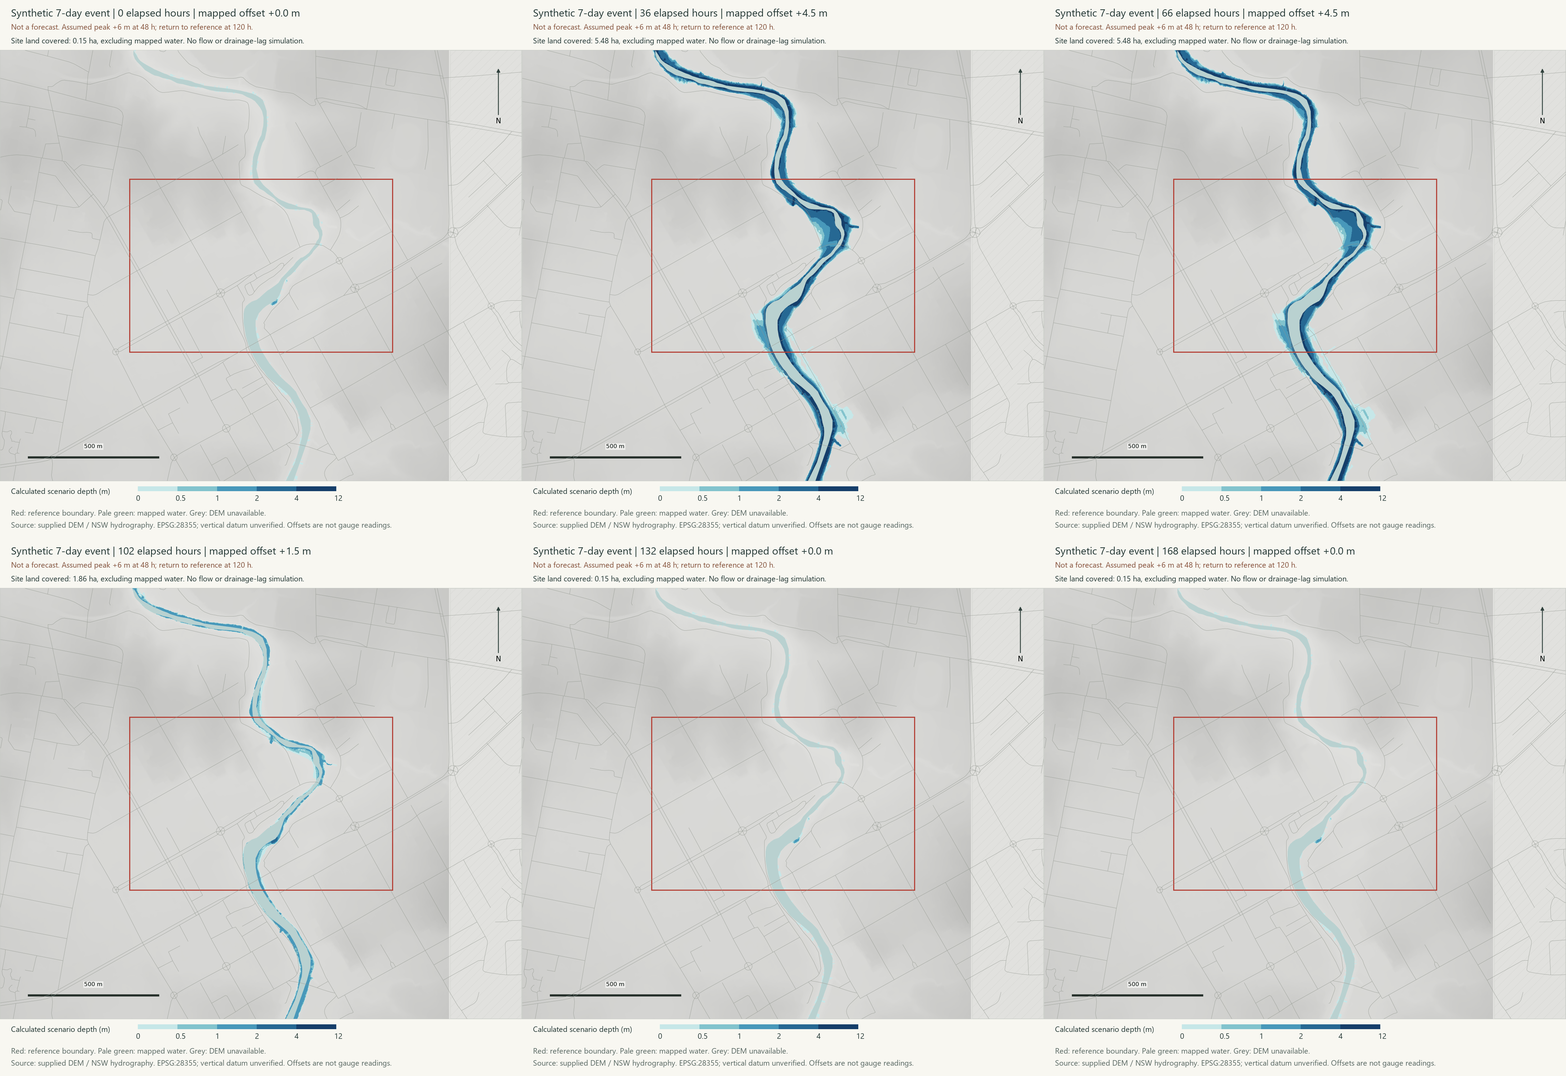
BOM forecasts at other upstream gauges are not Site02 inundation forecasts and are not imported into this model.
Longer horizons.
Different kinds of evidence.
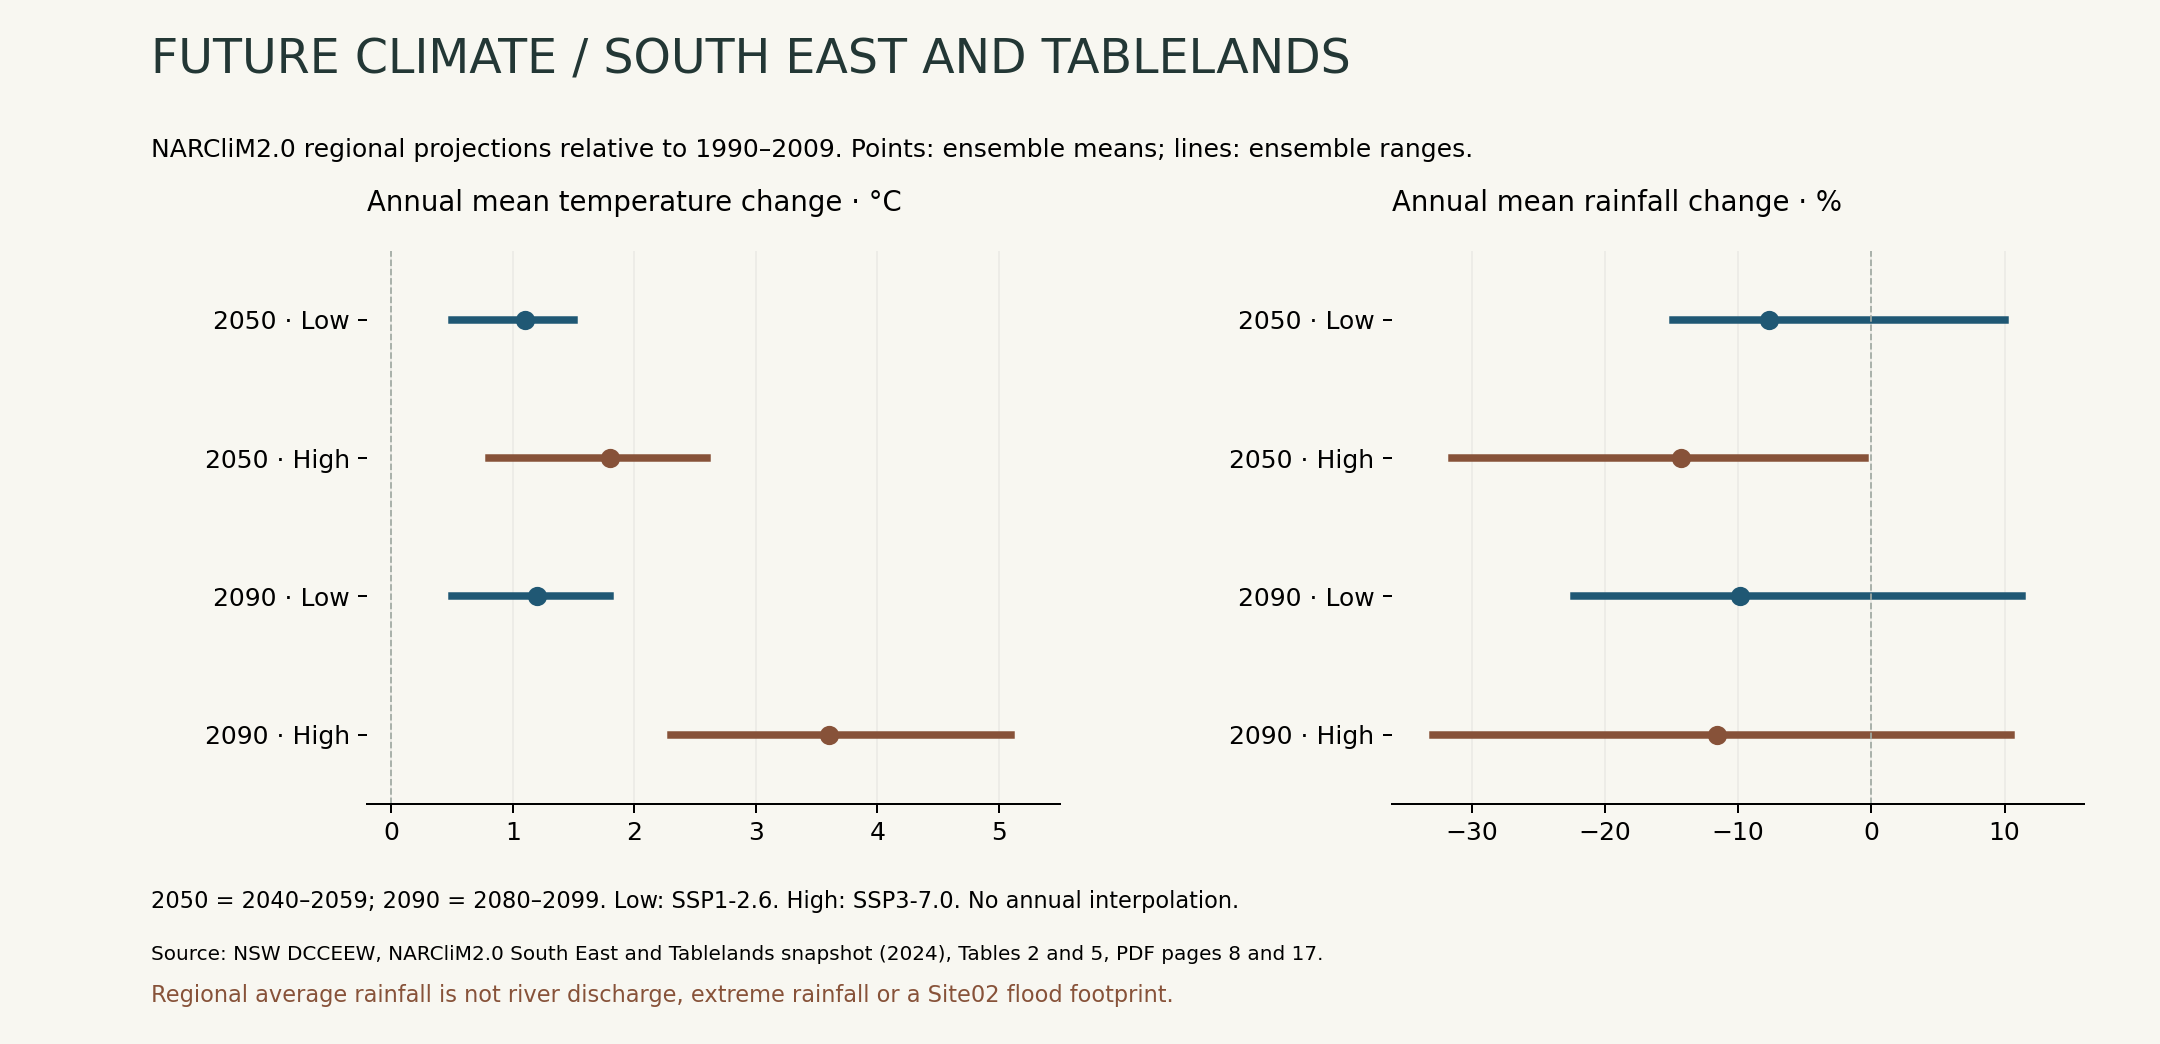
Regional climate projections describe future background conditions. The official flood sensitivity maps test heavier design rainfall. Explore them separately: no verified year-to-flood-footprint conversion is available here.
Projected annual mean temperature
Projected annual rainfall
Approximate regional values derived from the historical model baseline.
1990–2009 model baseline: 12.7°C and 743 mm/year. South East and Tablelands regional averages; these are 20-year climate projections, not Site02-specific or daily weather forecasts. Low emissions: SSP1-2.6; high emissions: SSP3-7.0.
How the projected values are calculated
Temperature = 12.7°C + projected temperature change. Rainfall = 743 × (1 + projected percentage change ÷ 100) mm/year. The same baseline converts the published change-range endpoints. Values are approximate, using rounded regional summaries; the converted range does not reproduce the full distribution of absolute values across individual models and is not a confidence interval. Temperature is rounded to 0.1°C and rainfall to the nearest millimetre.
The observed baseline (13.0°C and 723 mm/year) is not substituted for the model baseline. Only 2040–2059 and 2080–2099 are shown; no annual interpolation.
How might heavier rainfall alter flooding?
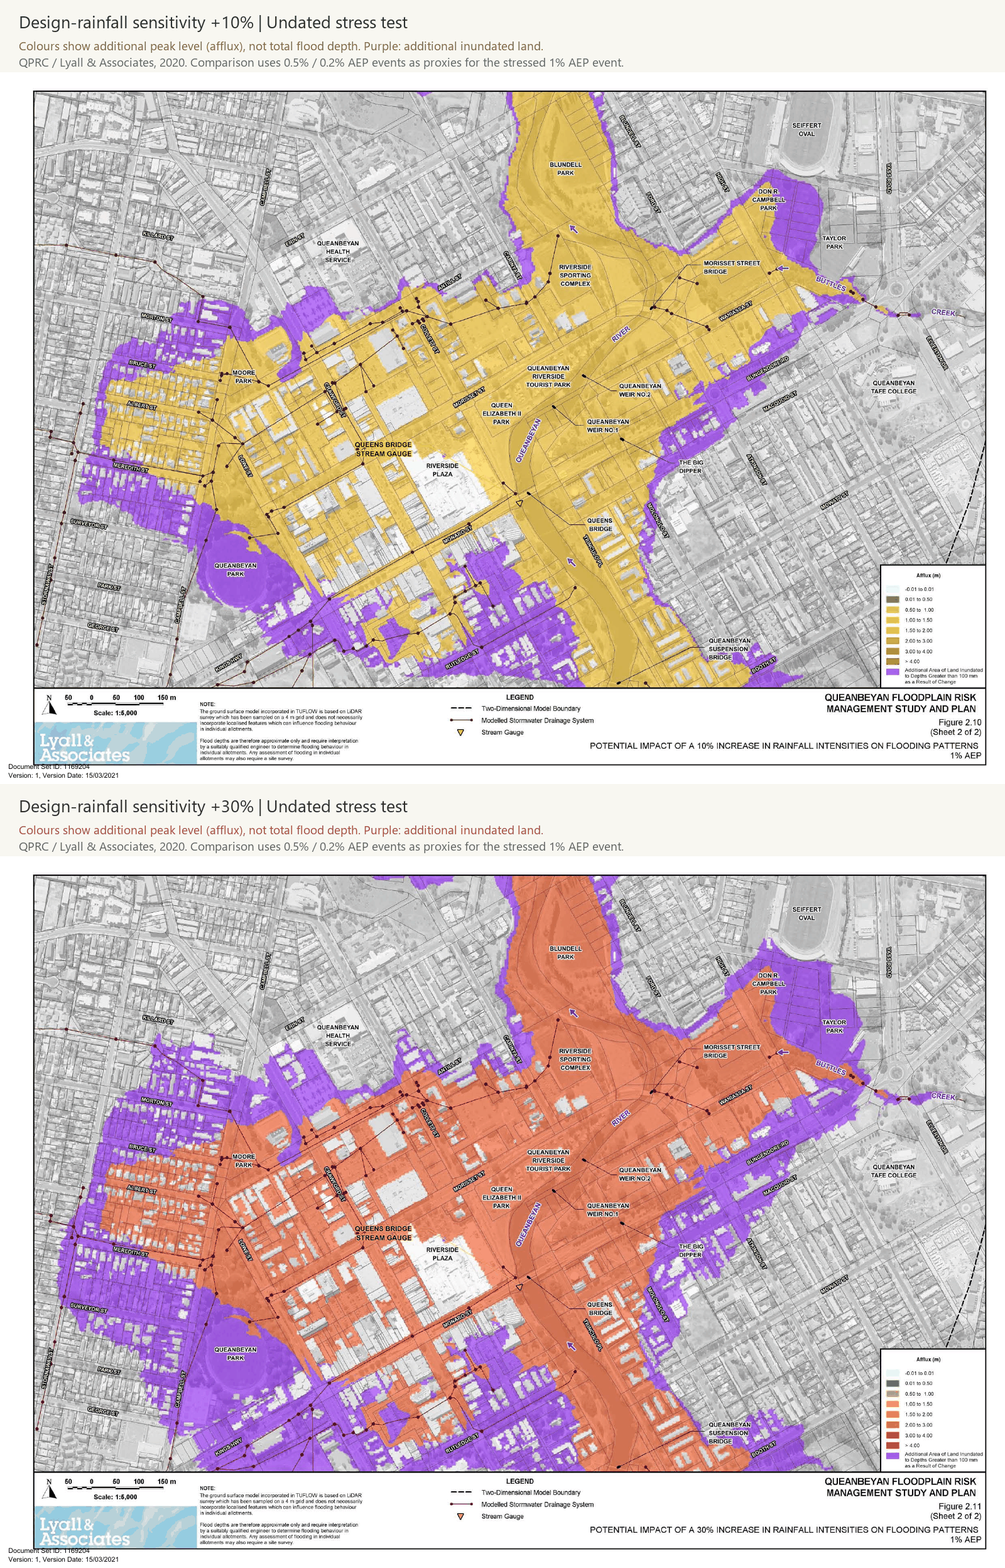
Official study · Section 2.10 ↗These are undated stress tests from the 2020 study, not forecasts for 2050 or 2090. Changing the climate horizon above does not change this map. The study uses the 0.5% and 0.2% AEP model events as proxies for a 1% AEP event with +10% and +30% design-rainfall intensity respectively.
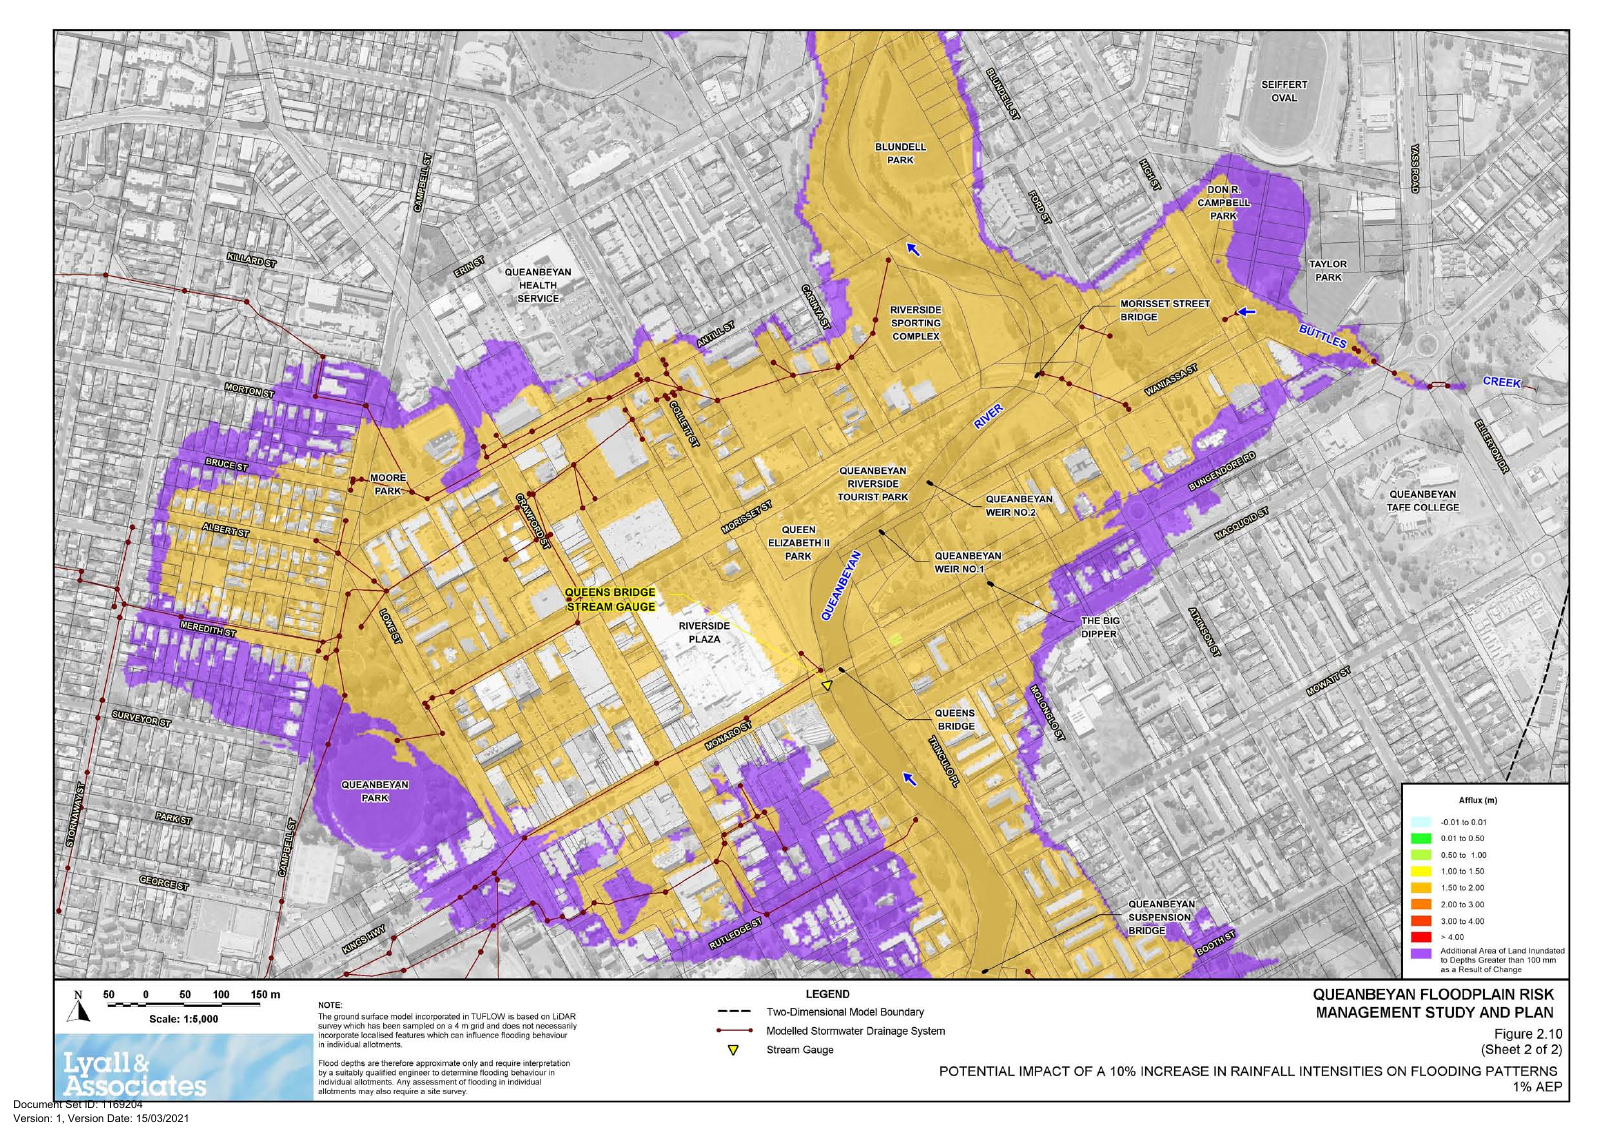
Figure 2.10, sheet 2 · Figures PDF page 20. © Queanbeyan-Palerang Regional Council 2020 / Lyall & Associates.
Questions for the river corridor
Compare additional inundation with access routes, riparian space and the existing observation atlas. Consider shade, refuge connectivity and room for floodwater as research questions. This page does not predict future populations or assign ecological damage to observed species.
What the maps hold fixed
River alignment, terrain and the supplied site boundary are held fixed. Erosion, sediment transport, bank migration, future development, restoration and dam-operation changes are not simulated. Lower regional average rainfall cannot be converted directly into a smaller channel or a lower flood peak.
Keep assumptions
visible.
The short-term animation is a controllable hypothesis. The long-term panels combine published climate evidence with separately labelled legacy flood sensitivity results.
Read methods, sources and limitationsHow the seven-day animation is calculated
The offset rises linearly from 0 to the selected peak, then falls linearly to 0 by the selected recovery time. At each hour it selects the nearest 0.5 m static map. The same offset has the same footprint during rising and falling stages; there is no retained-water or drainage-lag model.
These DEM scenarios have an unverified vertical datum and no calibrated relationship to discharge, rainfall, AEP or measured water level. Date labels do not turn them into a forecast.
Why there is no continuous 2030–2100 river prediction
The regional snapshot supplies 20-year climate summaries. It does not provide a dated Site02 hydraulic model or future channel geometry. No missing years, future river positions or site water depths have been invented.
Climate projection and flood sensitivity are distinct
NARCliM2.0 mean-rainfall projections are not extreme-rainfall adjustments. The official 2020 sensitivity maps use an older proxy method. A current engineering study would need updated rainfall guidance, hydrology, terrain, channel and structure data, dam operation and hydraulic calibration.
Australian Rainfall and Runoff · climate-change update ↗Sources and reuse
NARCliM2.0 South East and Tablelands revised snapshot, NSW DCCEEW, 2025, Tables 1, 2 and 5 (PDF pages 6, 10 and 20). QPRC floodplain study, 2020, Section 2.10 and Figures 2.10–2.11. Supplied Site02 boundary and ACT2015 DEM; source occurrence atlas is available in the Ecology section above.
Complete source and licence cataloguePeople, transport
& flood exposure.
Explore Census population patterns, an assumed daily activity animation, existing transport facilities and four concept improvement anchors. Screen mapped locations and road alignments against the river-stage scenarios.
Open the detailed people & transport atlas →
A dedicated interactive page with searchable affected locations, source links and downloadable GIS. Activity is illustrative; flood overlap is a screening result, not a forecast or road-closure assessment.
Assumptions remain
part of the result.
The explorer is a terrain-sensitivity study. Use the official 2020 floodplain study for flood-risk interpretation; the constructed offsets do not correspond to annual exceedance probabilities.
Read the complete research guideHow the reference surface is constructed
A 1 m DEM is sampled within mapped water, taking the 20th percentile in each 20 m northing band. A five-band median and non-decreasing southward fit form the profile, which is then extended laterally.
Candidate terrain: Z < Zreference + Δh
Only cells with four-neighbour connectivity to the river are retained. The reference is not an observed water surface or channel-bed survey, and 0 m is not observed normal flow.
Coverage, uncertainty and missing processes
The DEM covers 100% of the site and 86.03% of the model frame. Missing terrain is excluded and must not be interpreted as safe.
The vertical datum is unverified. Flow hydrographs, bathymetry, bridge/culvert hydraulics, defences, roughness and drainage networks are unavailable or unverified. The model does not estimate velocity, arrival time, pluvial flooding, damage or evacuation safety.
Changing the reference percentile from 10 to 50 gives +6 m land-coverage results of 10.60–11.58 ha. This is a method sensitivity range, not a confidence interval.
What rising and falling stage mean here
Playback increases the reference offset and then decreases it. There is no real time axis. The same offset has the same footprint in both directions because residual ponding and drainage are not simulated. This is a property of the method, not a conclusion about actual river behaviour.
Biological records and reuse
GBIF filters retain presence records from 2020 to 20 September 2026 with reported coordinate uncertainty ≤100 m. Records may represent repeated observations of the same individual, and the filter excludes many records without uncertainty values.
The retained records include 2,016 under CC BY-NC, 1,416 under CC BY and 3 under CC0. Respect the licence of each record and acknowledge its original publisher.
Data & references
Continue the analysis using the supplied GIS layers, numerical tables and original reports. Attribution, source links and limitations are retained in the accompanying documentation.
- Future river scenarios: 7 days and long-termINTERACTIVE
- GIS layer download catalogueGEOJSON
- All 17 water-level scenariosCSV
- Biological occurrence recordsCSV
- Rising / falling stage animationGIF
- Official 2020 flood study figuresPDF
- 2024 platypus & rakali reportPDF
- Historical flood peaksCSV
- 2010 documented gauge milestonesCSV
- Observation atlas & flood history guideGUIDE
- Source catalogue & licencesREFERENCE
Sources: supplied APRX and ACT2015 DEM; NSW Spatial Services; NSW DCCEEW SVTM; GBIF and original data publishers. Source occurrence records and static stage outputs are retained. The atlas and historical comparison add new ways to inspect the evidence. Calculated coverage is not a measure of ecological damage.