People, transport
& a rising river.
Explore daily activity patterns and existing facilities around the Queanbeyan River, then examine where they overlap exploratory flood scenarios.
Site02 + 2 km urban context · Census 2021 · OpenStreetMap facilities
Activity is an assumed relative pattern. Flood overlays are static sensitivity tests, not forecasts or road-closure information.
Click a feature for its source and screening result, or use the searchable location table. Unshaded terrain inside the coverage outline is assessed only for the selected scenario.
Orange circles show relative activity potential (0–1), fading outward to 180 m. They do not represent observed people, movement paths or crowd density. Changing the hour does not change the flood scenario.
Map data © OpenStreetMap contributors, ODbL; Census © Australian Bureau of Statistics. Prepared for site research.
Where might activity
meet flood exposure?
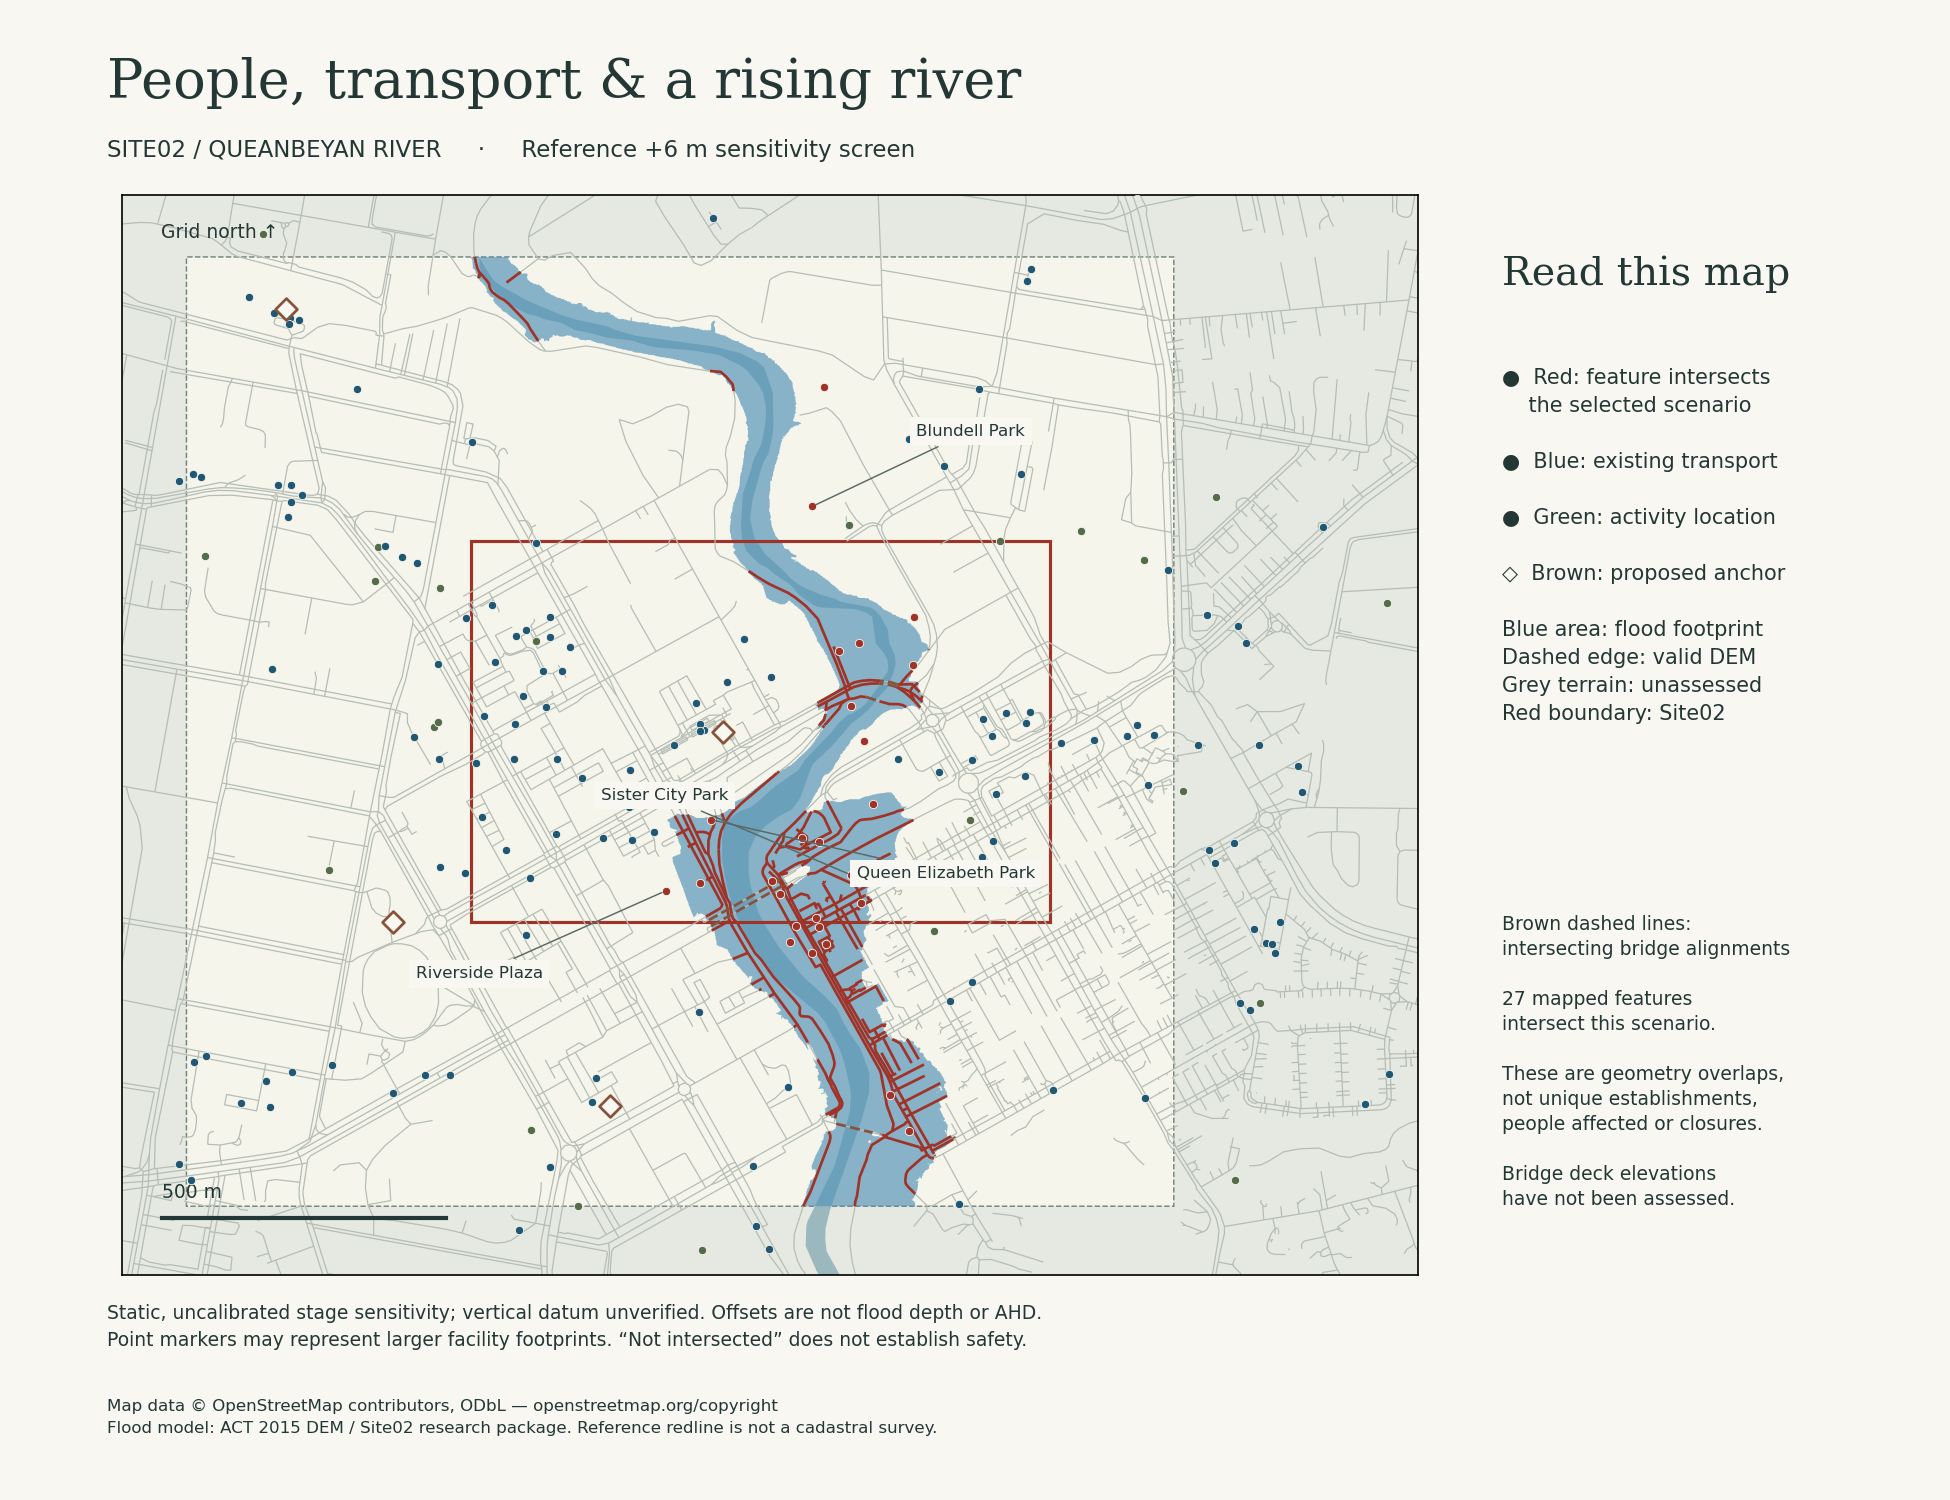
The list follows the selected flood offset. A mapped park or facility footprint may intersect only at its edge. Counts refer to map features, not unique establishments, people affected or closure decisions.
| Mapped location | Type | Selected scenario | Explore |
|---|
“Not intersected” is not a safety assessment. “Not assessed” means that at least part of the mapped geometry lacks terrain coverage. Bridge alignment intersections do not establish deck inundation.
Four places
to investigate.
Concept improvements anchored to existing mapped facilities. These are study candidates, with no confirmed footprint, ownership consent, demand assessment or engineering approval. They are not evacuation points.
Optional 400 m circles indicate straight-line proximity from each anchor. They are not walking catchments and do not account for river crossings, barriers, gradients or access restrictions.
Evidence, assumptions & reuse.
What is observed or mapped?
ABS Census 2021 mesh-block counts record usual residents and dwellings. Density uses each full block’s ABS area, even where its display is clipped to the study area. No population total is estimated inside the redline or flood footprint.
OpenStreetMap supplies roads, paths, stops, parking and activity facilities, retrieved 21 September 2026. Coverage and operating status have not been field verified. Known private/no-access parking and recreation features are excluded; unknown access is retained and identified. Multiple mapped features may describe one place.
The map covers the reference site and its 2 km surroundings, not the whole river catchment. Coordinates are analysed in GDA94 / MGA zone 55 (EPSG:28355); downloadable GeoJSON uses WGS84 longitude/latitude.
How is activity animated?
Each mapped activity category receives an explicitly assumed hourly weight, with different weekday and weekend profiles. Circles use a fixed 180 m display radius and a common 0–1 opacity scale. The chart is the mean weight of mapped features. No device traces, pedestrian counts, service frequency or calibrated travel model were available. Proposals do not generate extra activity.
How is flood exposure screened?
Mapped geometries intersect the existing connected static flood footprints at reference offsets +0, +2, +4, +6 and +8 m. Coverage is derived from valid 1 m ACT 2015 DEM cells. Its vertical datum remains unverified. The reference is a constructed river-elevation profile, not measured normal water level.
Facility polygons use the mapped footprint; point features and proposal anchors use their location only. Road/path outputs contain geometric intersection lengths. There is no bridge-deck, culvert, drainage, depth–velocity or road-passability calculation. Geometry validity is repaired in analysis copies; source files are retained.
Outside or partly outside terrain coverage remains unassessed unless an overlap can be established in the covered portion. Even an intersecting feature can have additional unassessed geometry. No affected-person count is inferred from Census blocks.
Flood footprints stay fixed during the daily activity animation. The atlas’s separate rise-and-recession scenario remains available in Future river scenarios.